A quick look at this project
GradCafe is a platform where grad school applicants share admission status and communicate updates. One thing all applicants need is information - when to expect an interview, whether being put in a waiting list or receiving an email starting with Congratulations. The uncertainty that comes with these questions can be relieved to certain degree with information from other applicants.
As freshly admitted grad students, we are curious about what we can know about application in Statistics over the last decade from GradCafe, where we have access to 10,000 application results from 2010 to 2020 with information on the program, year, applicant undergrad GPA, GRE result, admission status, etc.
We also incorporate two major university rankings in Statistics: U.S. News and QS World University Rankings as these rankings are reliable indicators of academic reputation of a particular university and program, which can affect decisions of both applicants and programs significantly. Besides, these two rankings are selected to represent the major domestic and international evaluation of universities.
With three datasets on admission result and ranking scraped, we are able to answer two major questions below.
- What kinds of programs are popular among the applicants in Statistics?
- What kinds of applicants are usually preferred by Statistics graduate programs?
METHOD & TECHNIQUES
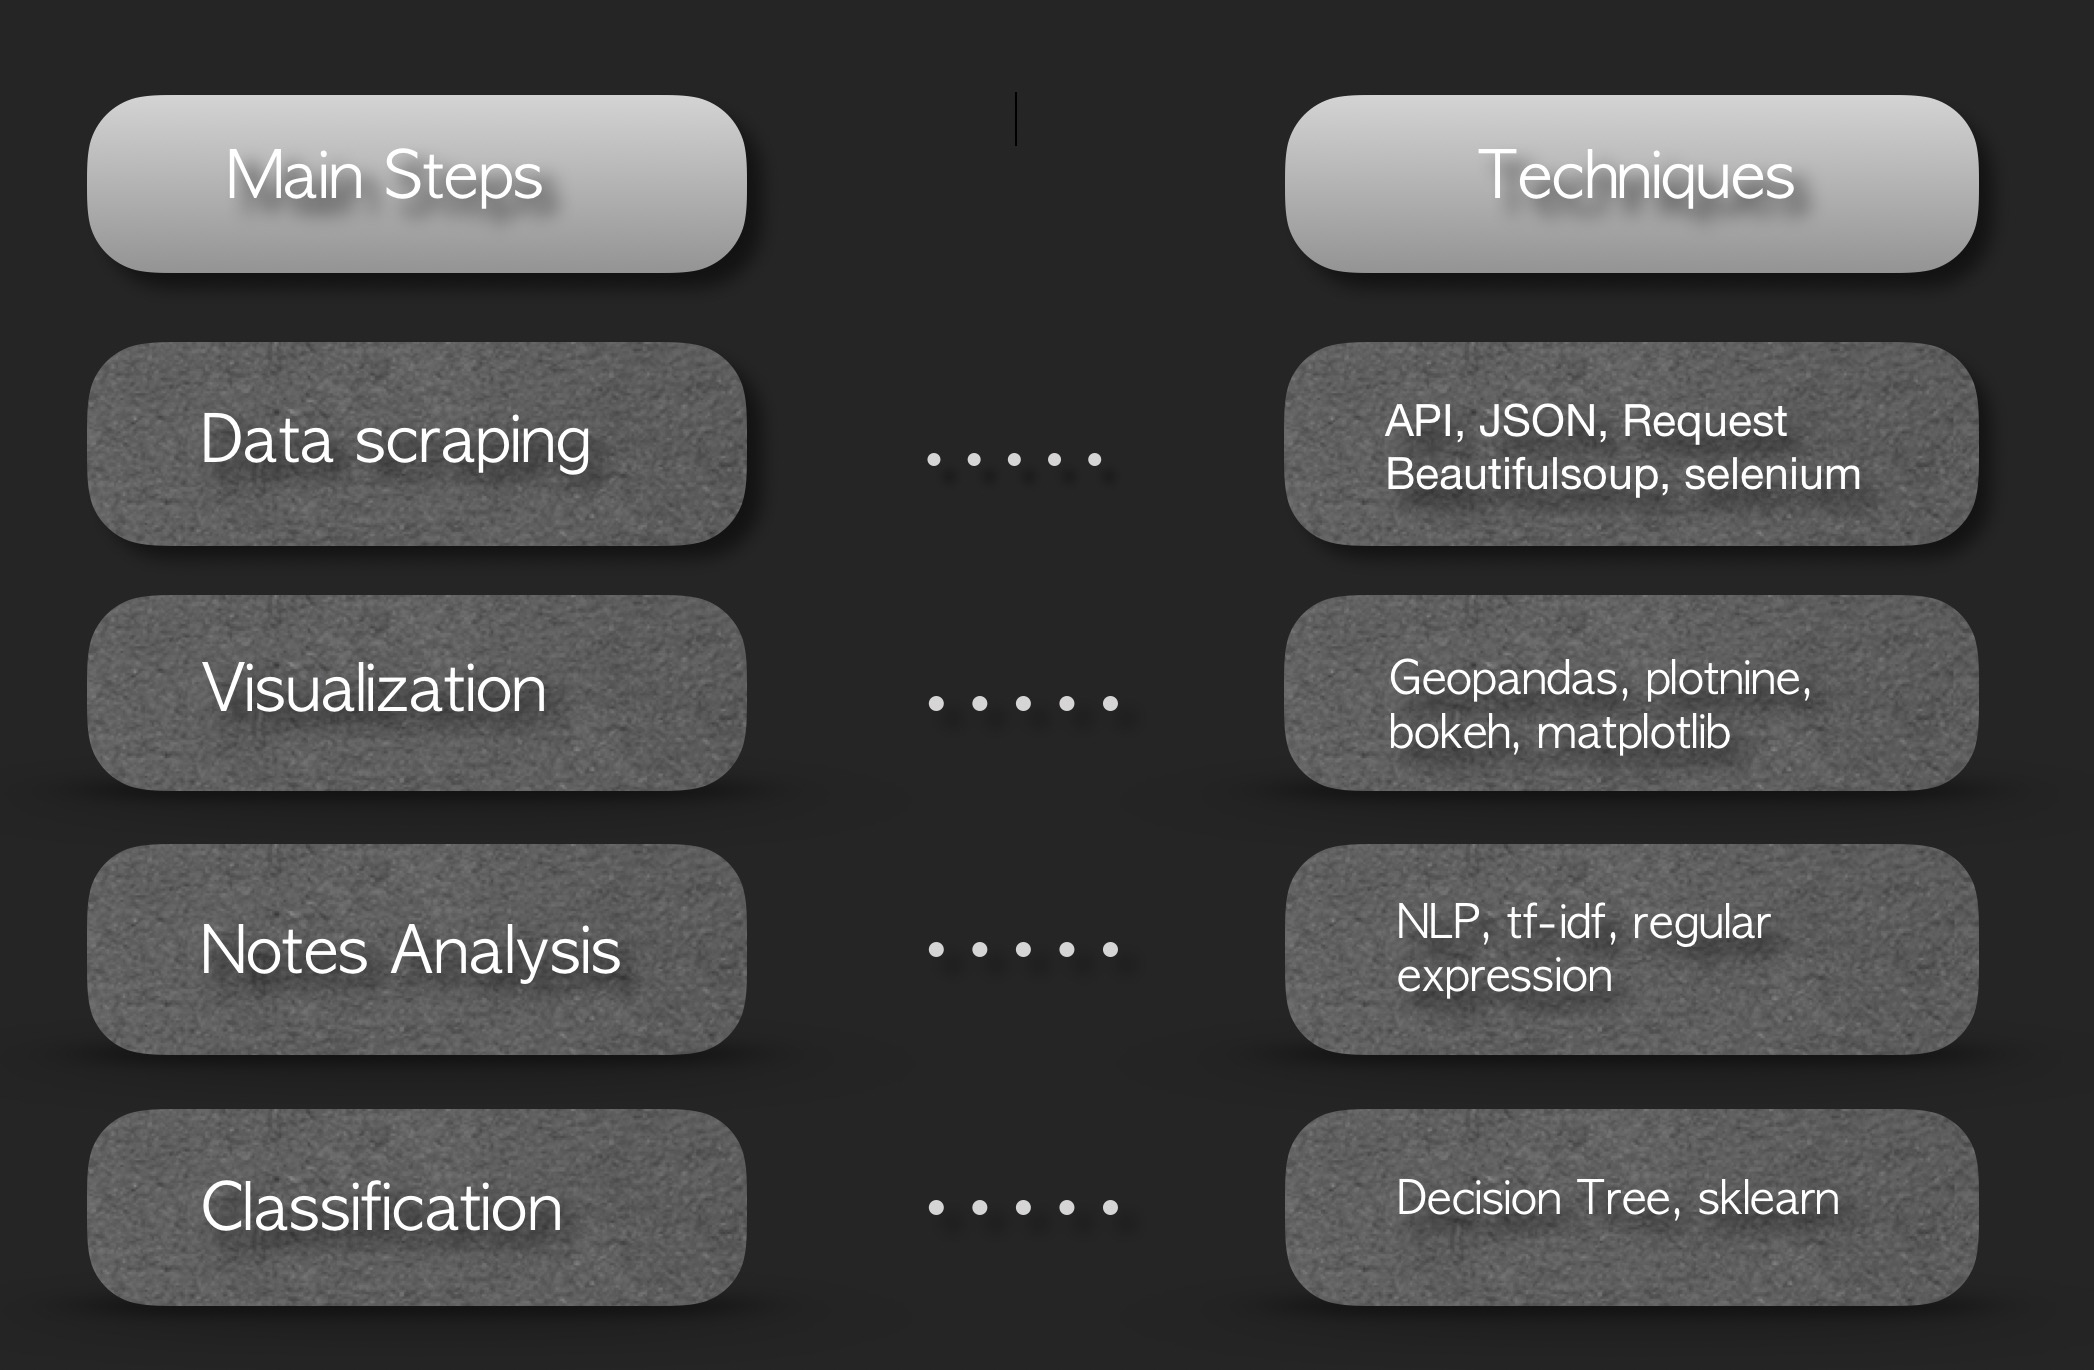
We divide up our projects into four parts including Data scraping, visualization, Notes analysis and classification. Before we move on to the details of our results in each parts, the methodologies and techniques we used for this project are summarized in this table.
Exploratory Data Analysis
We first conducted exploratory data analysis on the Gradcafe dataset and got some prelimilary findings about applicants in Statistics.
1. Is my GPA good enough?
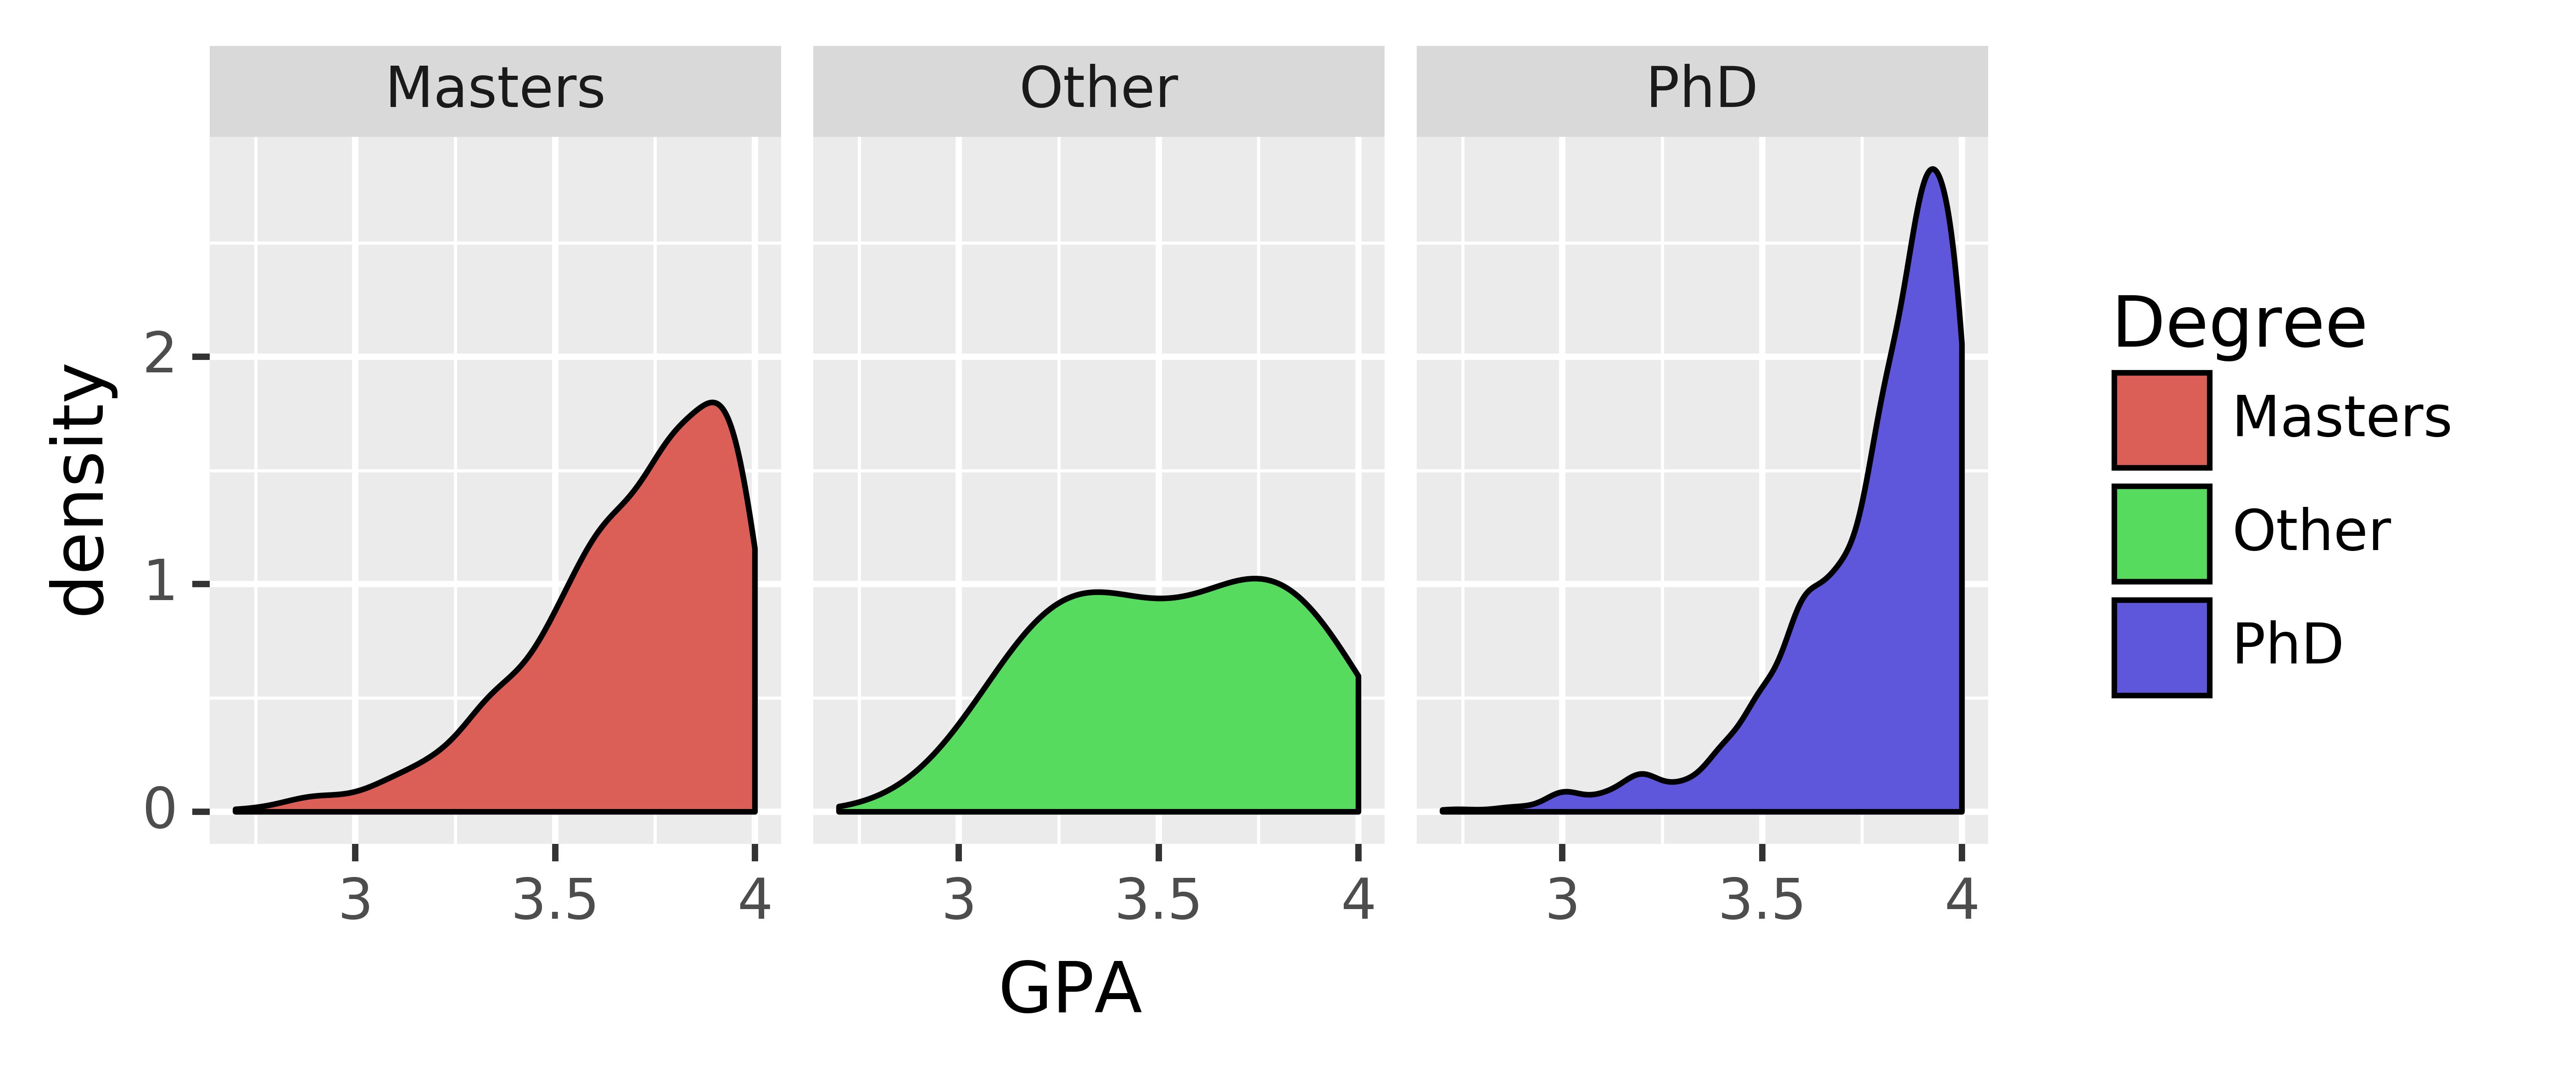
We created a density plot of applicants' GPA by degree, whether it is a doctoral, master's, or other program. It can be noticed that most applicants of doctoral degree on Gradcafe have a GPA over 3.5, and applicants mostly have a GPA close to 4, while the density of applications with such high GPA is much smaller for a master's degree in Statistics, which is approx. 1.7. Therefore, we can conclude that applicants of doctoral program generally have a higher GPA than applicants of master's program, which also indicates that Statistics doctoral program is generally more competitive and demanding than a master's program.
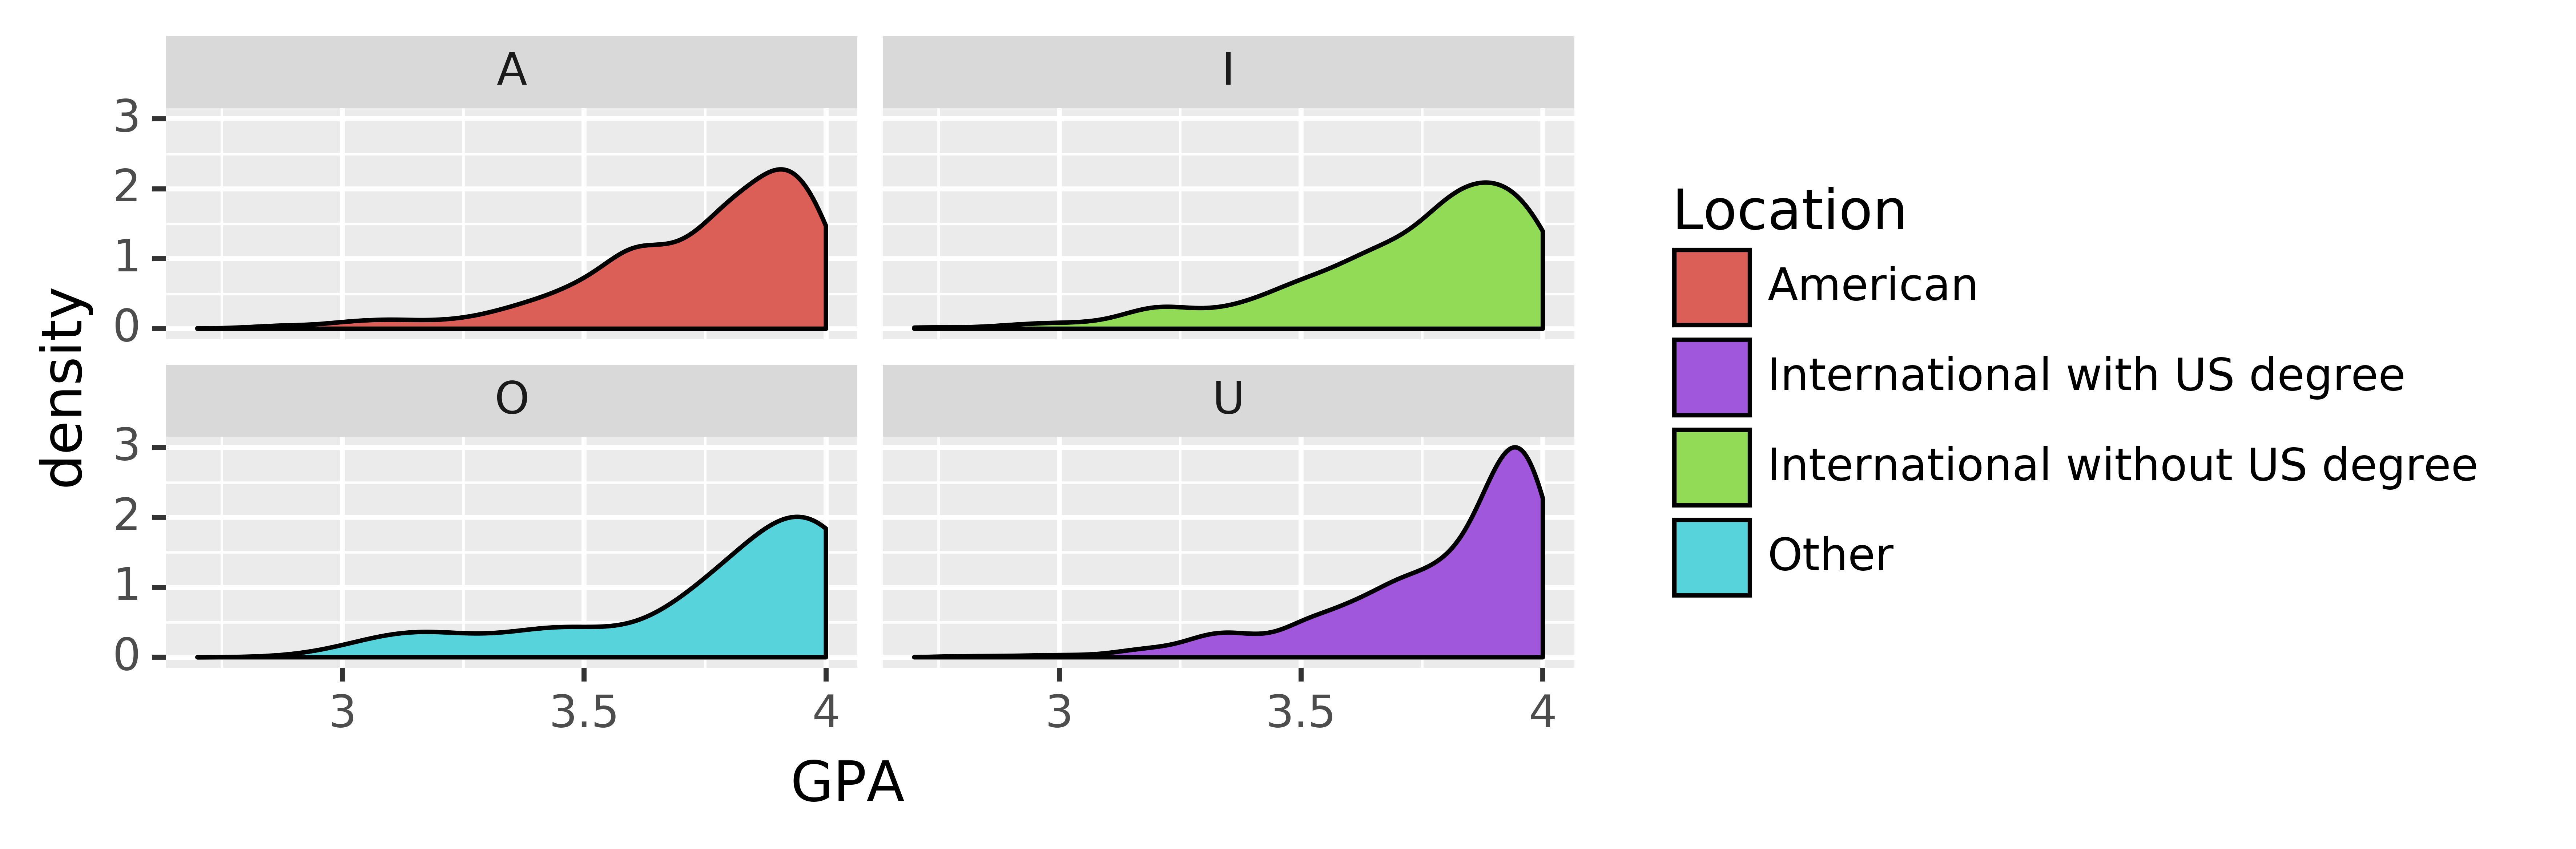
We created four density plots of applicants' GPA by locations of applicants' undergraduate institution and nationality: whether applicants received a degree from U.S. or international institution, and whether the applicant is U.S. citizen or not. Most applicants have a GPA over 3.5 across all four locations, though the number is particularly high for international applicants with a U.S. degree where most applicants have a GPA around 3.9. However, the general distribution for all four locations is similar and there is no significant difference across locations. It worths noticing that different institutions have different GPA systems and policies: some insitutions and programs tend to have a more strict grading policy than others.
2. Who has better GRE scores?
GRE score is another important indicator of applicant competency and mostly required by Statistics postgraduate programs. GRE score constitutes three parts: quantitative, verbal, and analytical writing. We created four density plots of applicants' GRE by locations of applicants' undergraduate institution and nationality.
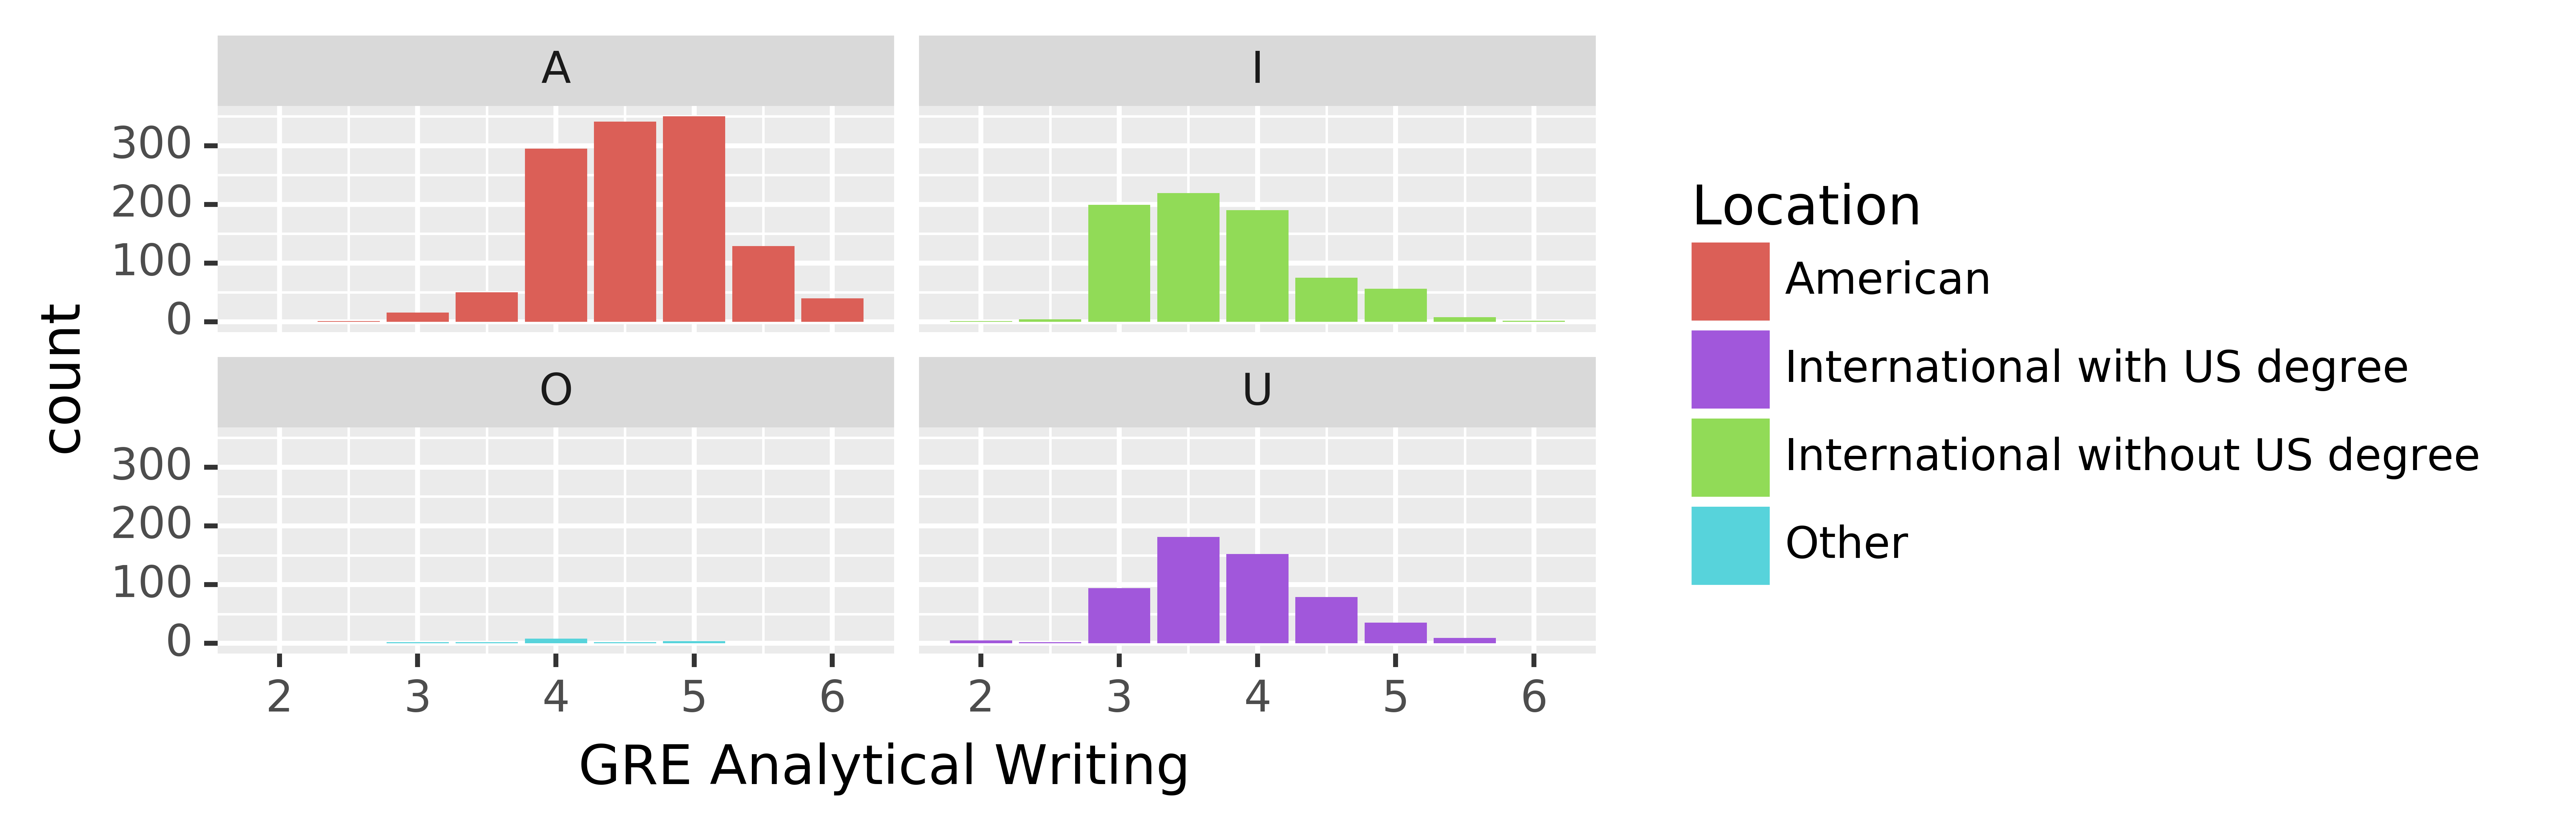
As expected, Americans generally have higher analytical writing scores than international students; international students with a U.S. degree tend to have higher scores than those without a U.S. degree. This conclusion makes sense as analytical writing is conducted in English; applicants with U.S. degree or are native speakers should achieve higher score in this section.
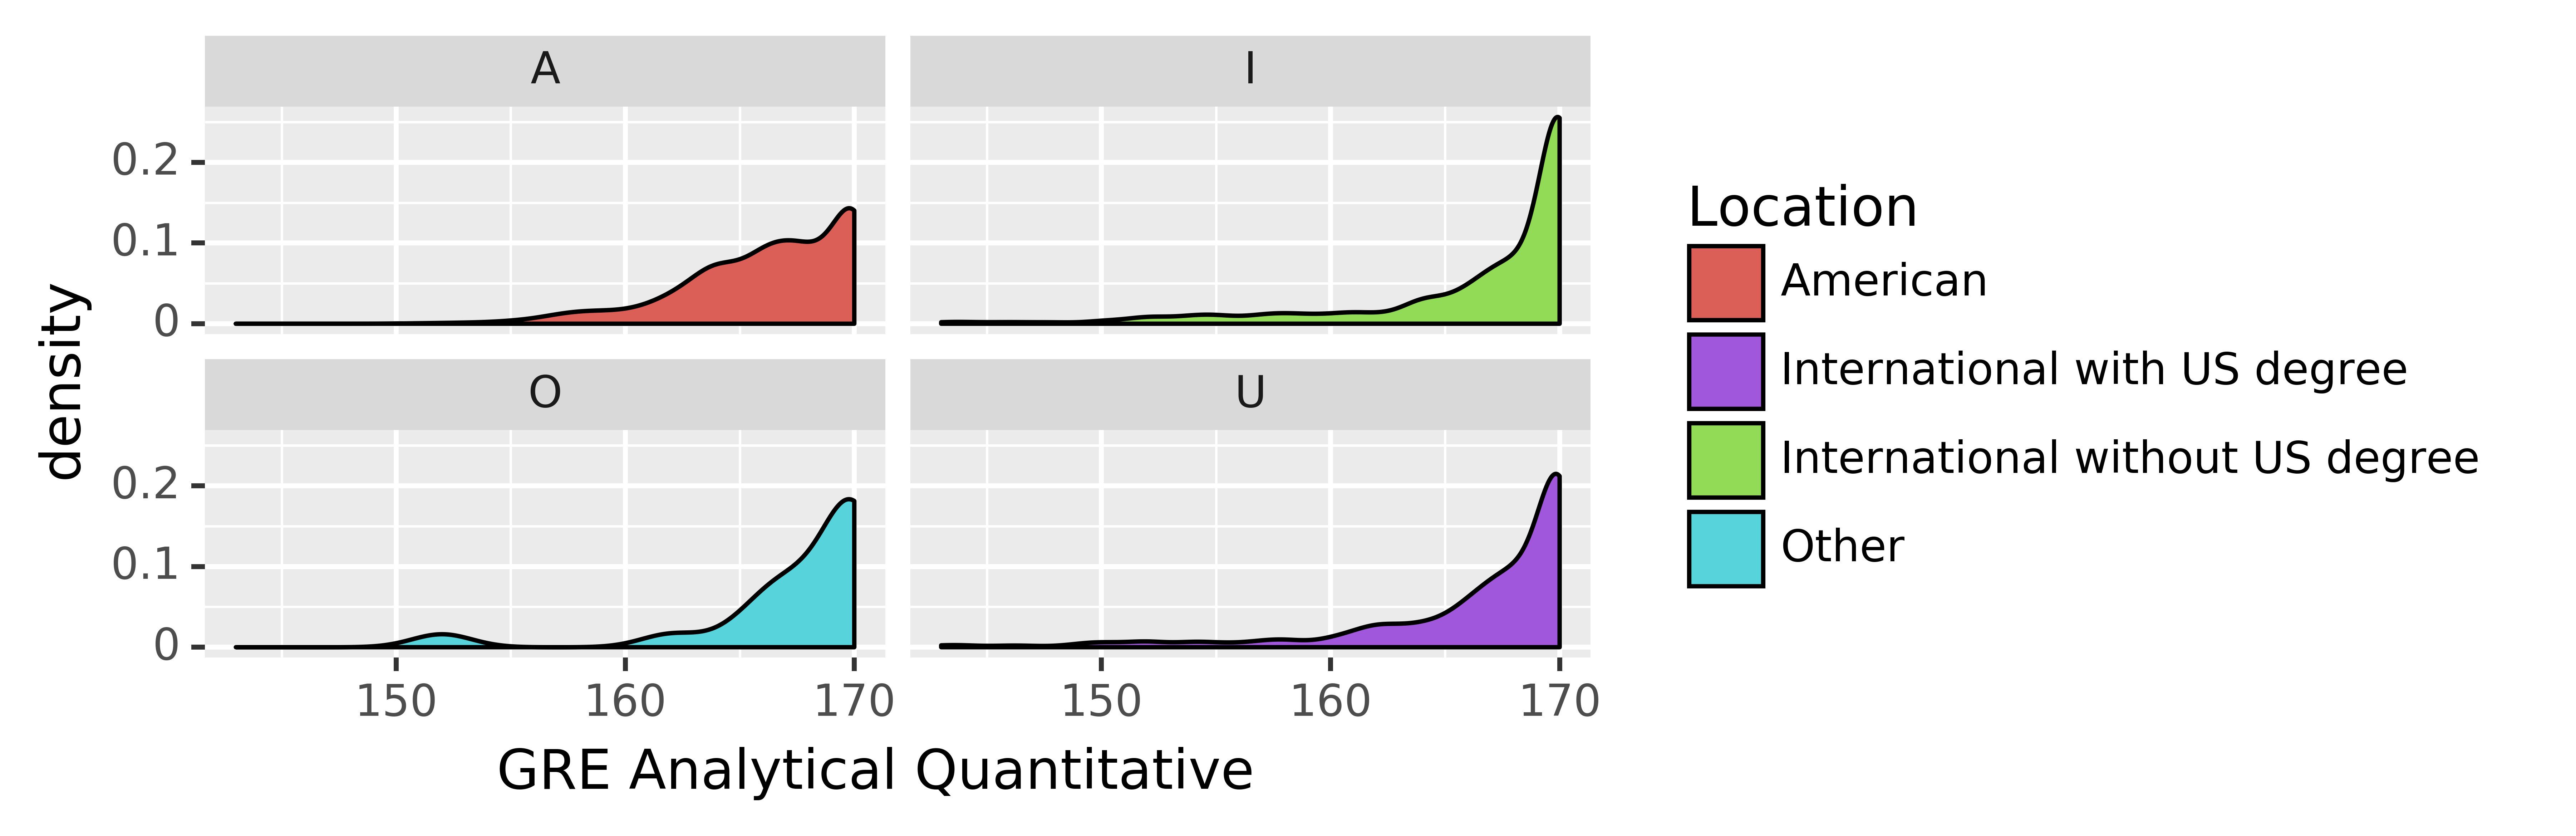
For quantitative section, international applicants tend to have a close-to-perfect score, which is much higher than that of American applicants and international applicants with a U.S. degree.
3. When will I know admission decisions?
We compare the timelines of different institutions in terms of making decisions on PhD admission. This is presented by yearly aggregated counts of events. For example, we compare UC Davis and Stanford.
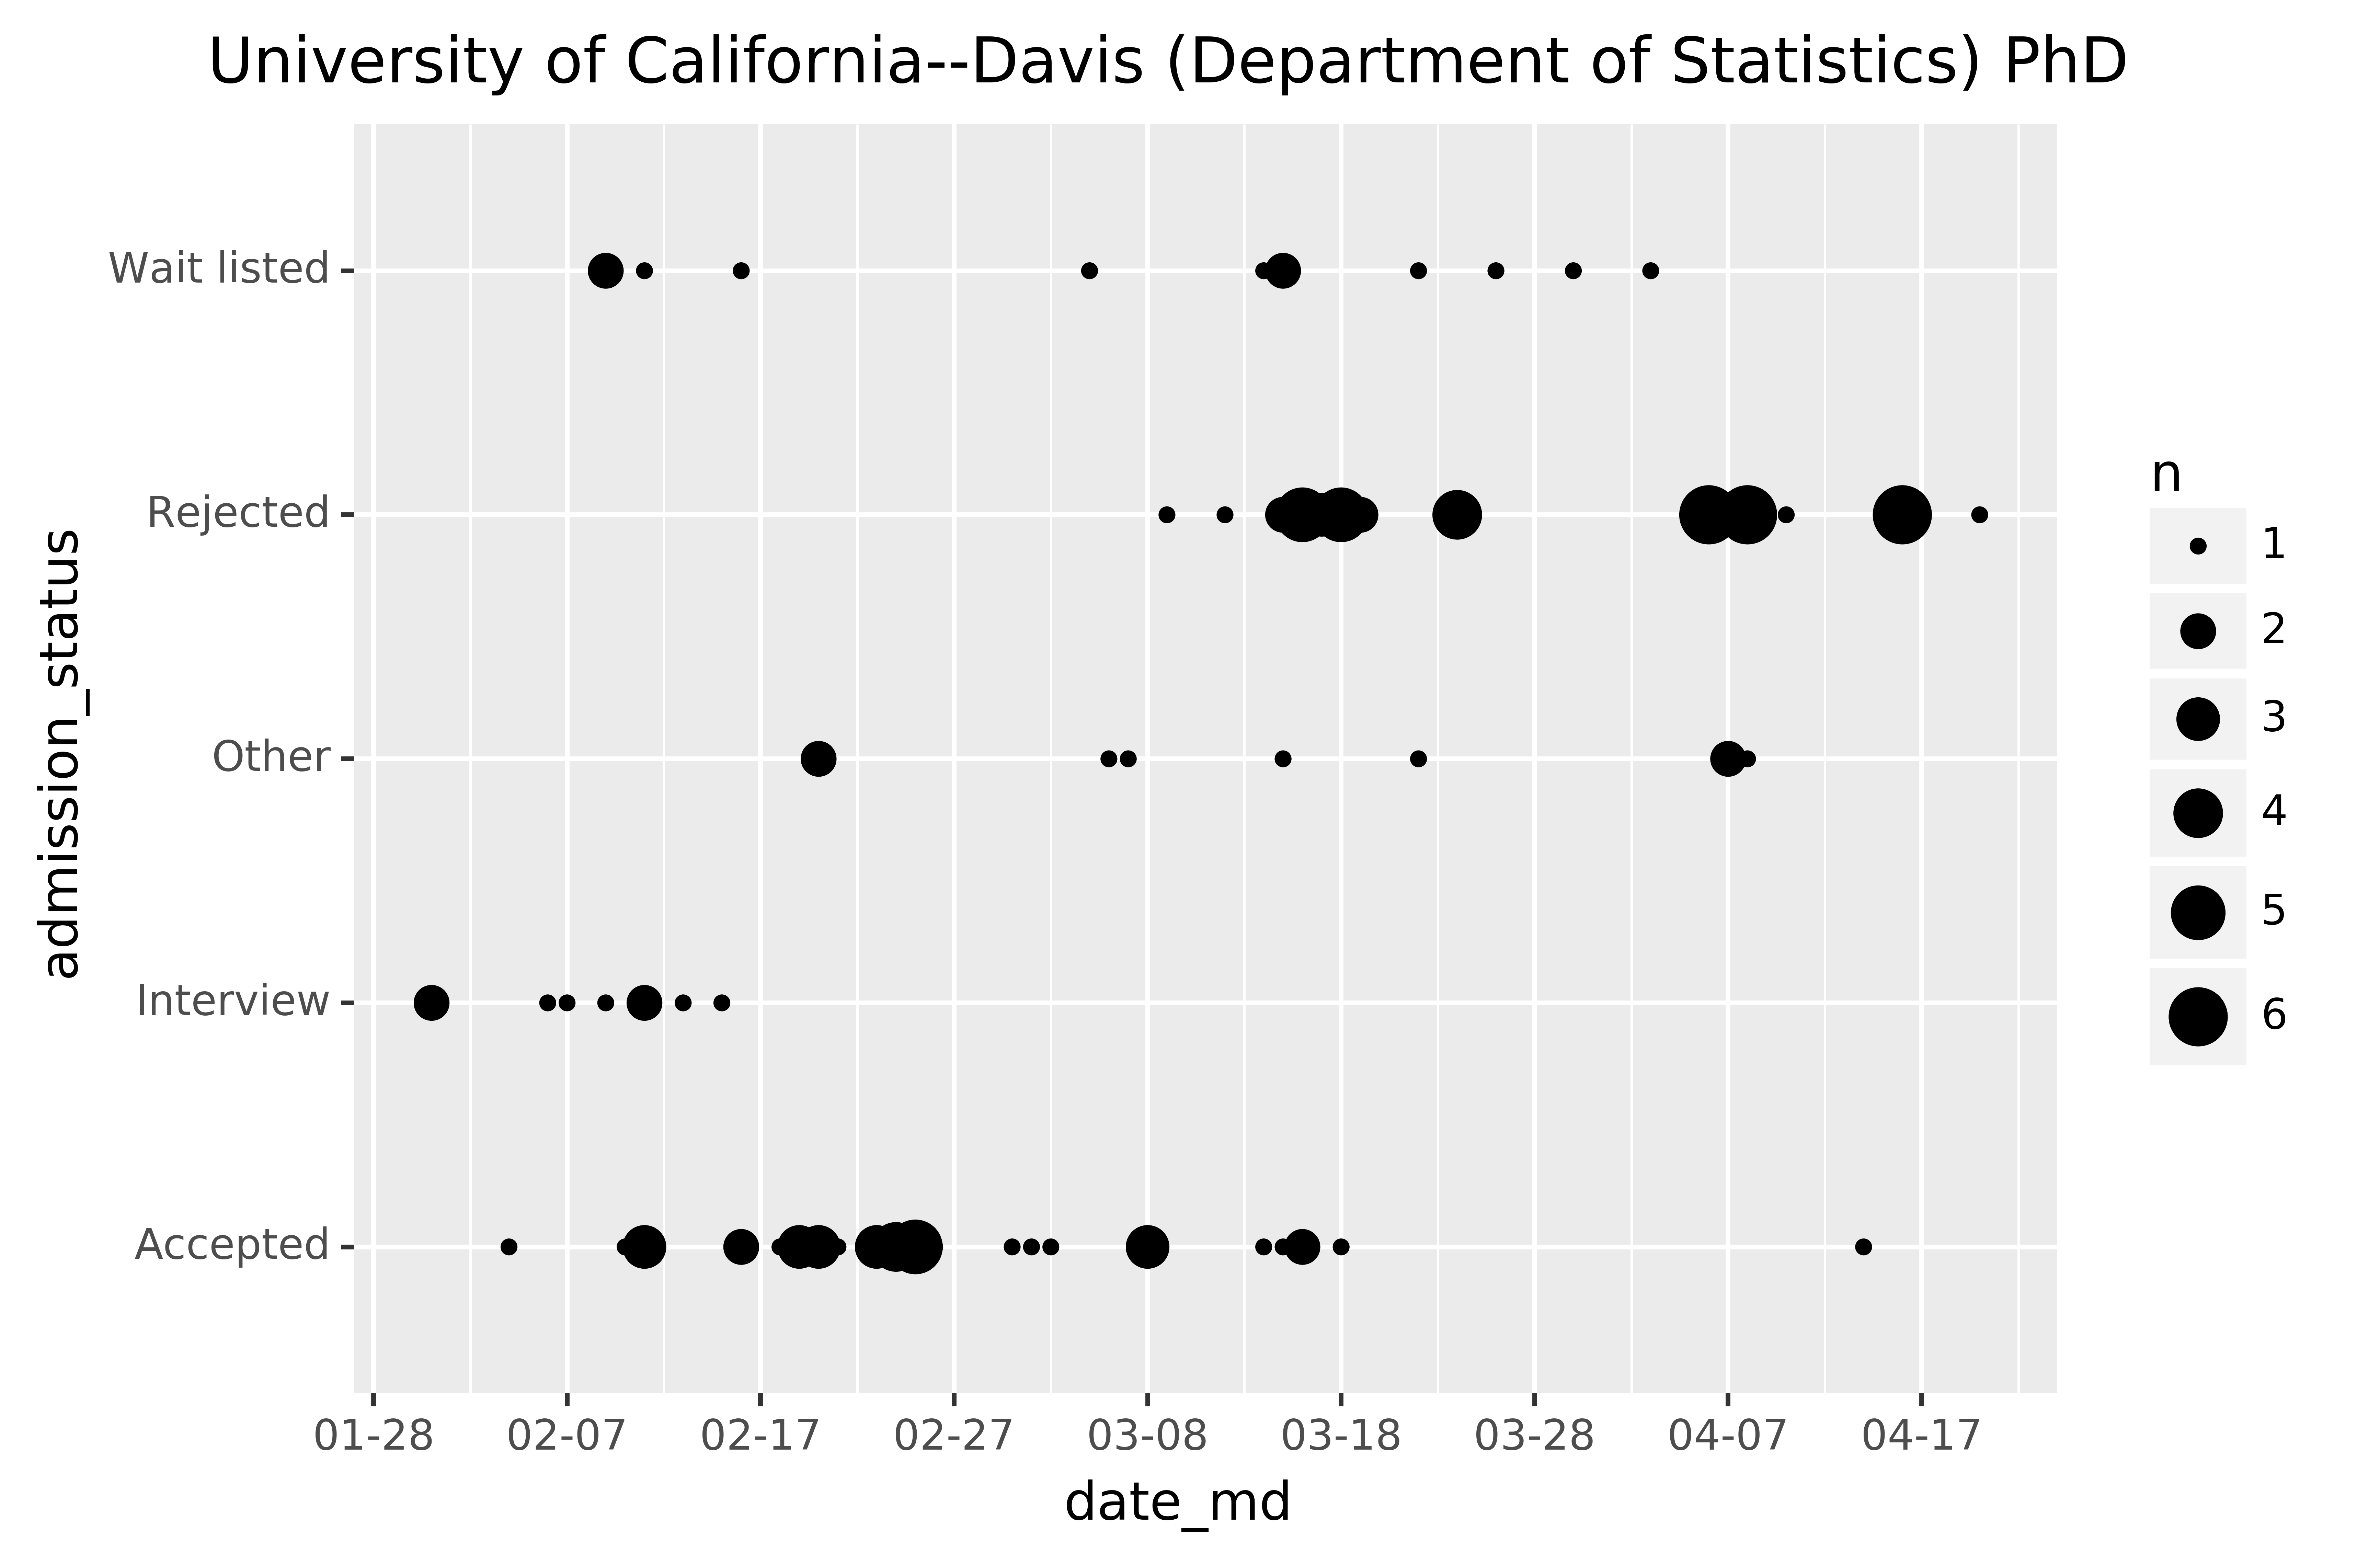
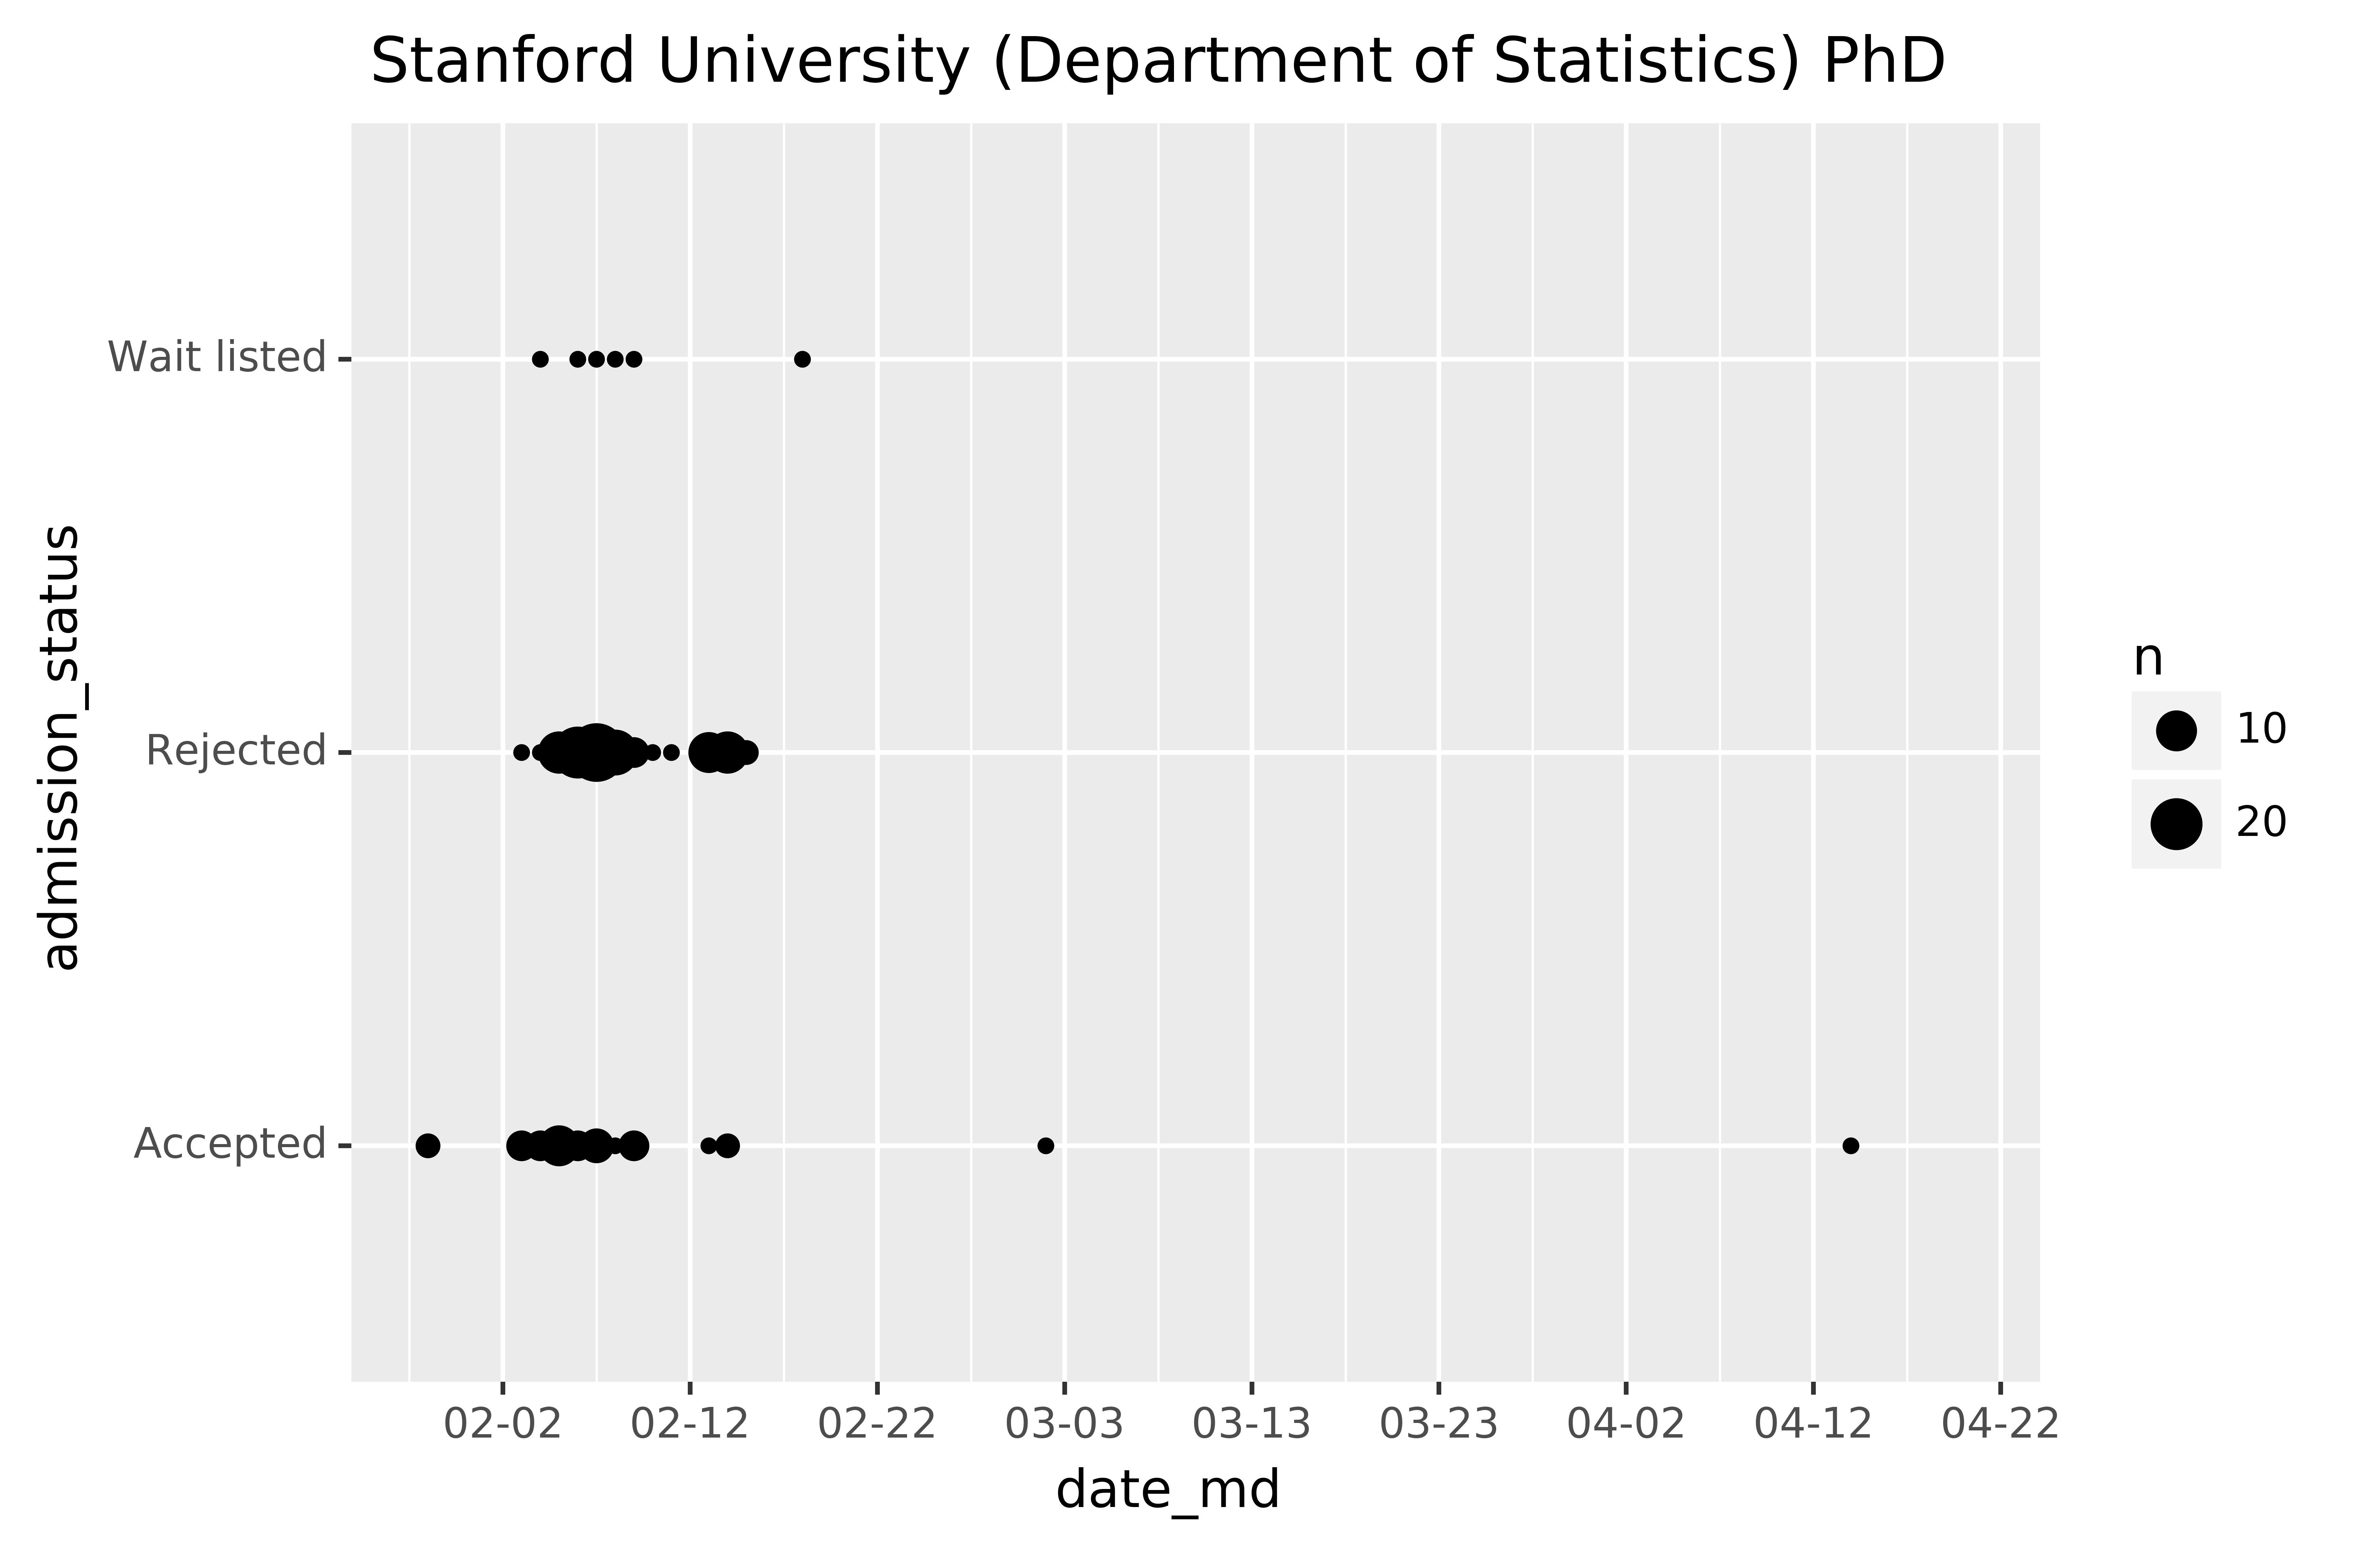
We see that Stanford is considerably earlier in terms of making decisions on admissions and rejections. Most of their decisions are made before the middle of Feburary, when UC Davis is still beginning to interview applicants and give offers. Another interesting fact is that Stanford seems to never interview applicants.
After comparing more timelines of different schools, we find that schools with higher ranking tend to make decisions earlier. This fact is consistent with our common sense.
4. Which program is the hardest to get in?
Although this dataset from Gradcafe can only represent a small part of the applicants, it's nevertheless interesting to compare the acceptance rate among all applicants of different programs, which we believe would partially reflect the difficulty in getting in this program.
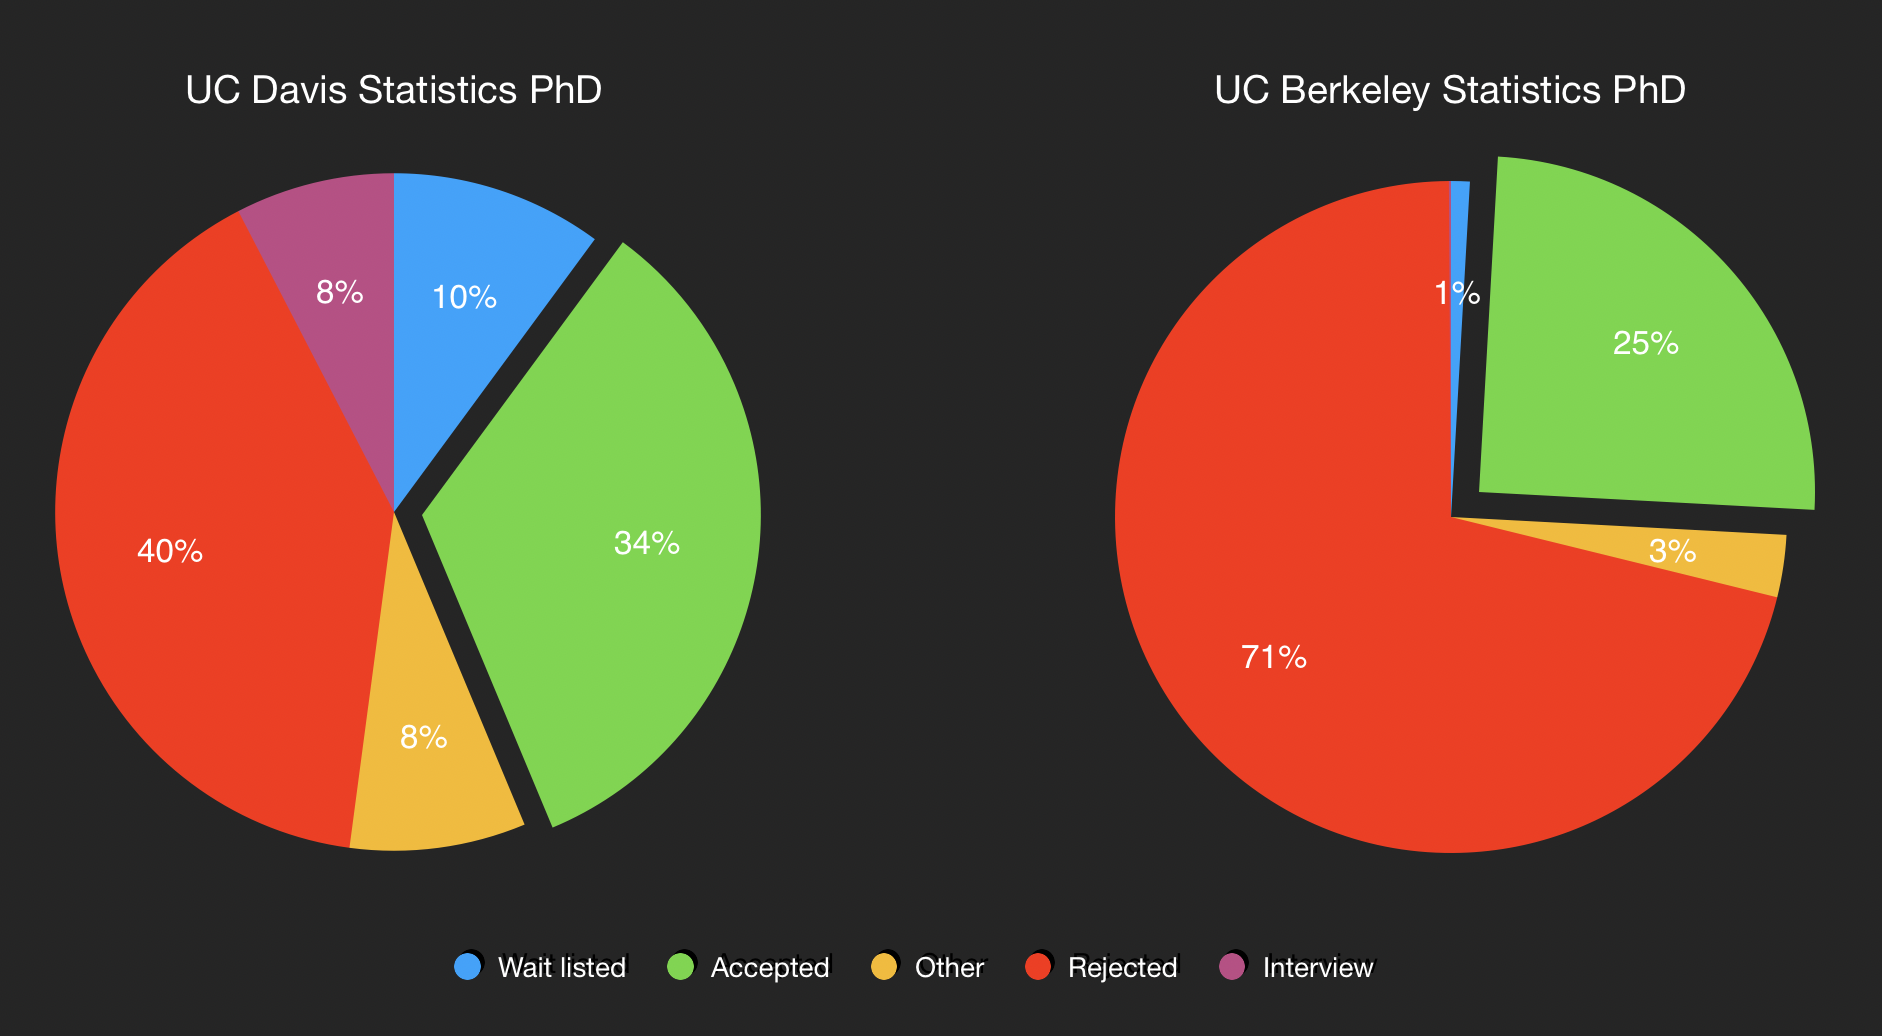
Comparing UC Davis and Berkeley, the rejection rate of Berkeley is considerably higher. Berkeley ranks top 2 in Statistics subject according to USnews, and it is very difficult to get in.
We can see which school has the lowest admission rate of Stats PhD, by an naively estimate--the count of admission divided by the sum of the counts of admission and rejection. In our data, Duke University has the lowest admission rate 17.6%, followed by UPenn 19.2% and Harvard 21.8%. Ohio State has the highest adimission rate 76.6%. Following is the ranking of admission rate in our data.
However, we should keep in mind that this dataset may be a biased sample, or in other words, missing not at random. For example, people may be more likely to report their acceptance than to report rejection on Gradcafe. Therefore, we expect this acceptance rate to be an overestimate--You will not believe OSU accept 77% of all applicants each year!
5. How diverse is the program?
As PhD studetns in UC Davis, we found the proportion of international students in our department to be particularly high. Is this also true for other schools?
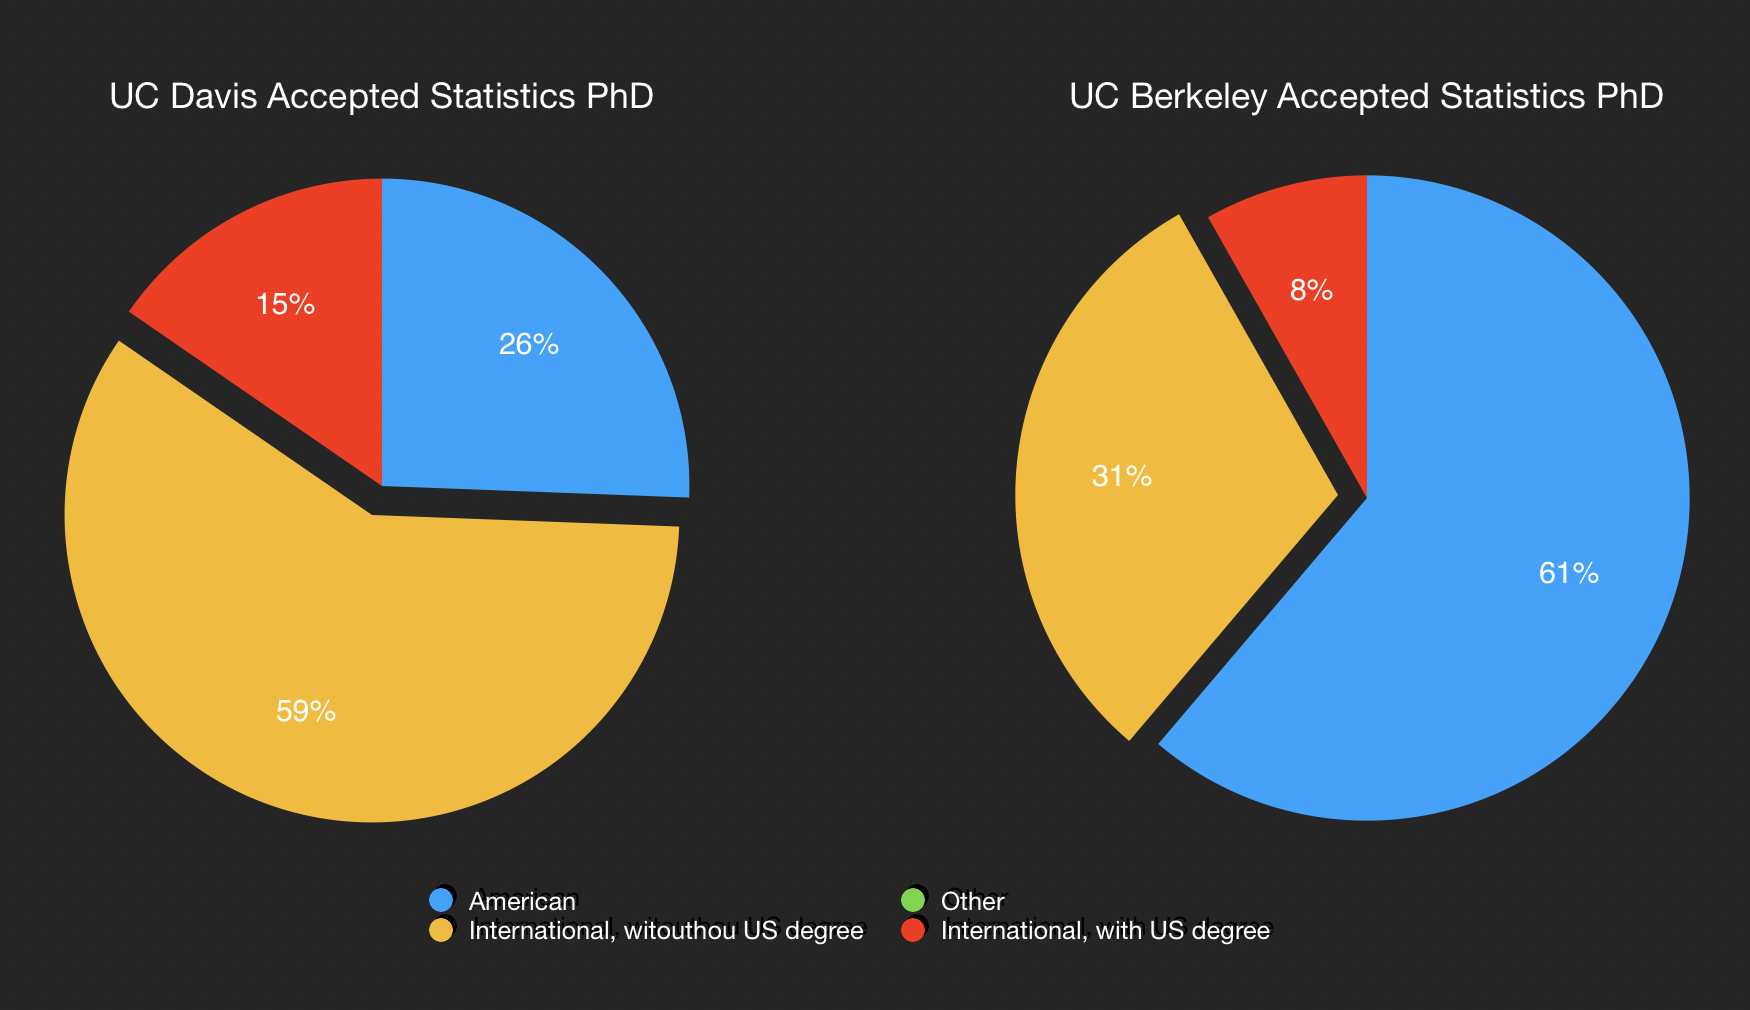
We found that many other schools, e.g. UC Berkeley, do not have so many international PhDs as in UC Davis Statistics. We can have a look at which school prefers international students most in terms of PhD in Statistics. In our data, Stanford has the highest international proportion 62.5%, followed by Columbia 62.2% and 59.0%, while Rice has the lowest international proportion 16.7%. Following is the ranking of international student proportion.
Still, we need to point out that this dataset may be a biased sample of the whole applicants. We believe that the proportion of international students in this dataset is likely to be underestimated, because many international students do not know Gradcafe and therefore do not report their results on Gradcafe.
INTERESTING FINDINGS
1. What kinds of applicants are preferred?
What applicants are most concerned about is how to increase their chances of admission. Thus we further look into the mechanism of graduate admission and hope to guide the application of prospective students. Given the complexity and diversity of the data, we constructed a decision tree classifier to find the influential factors in graduate application.
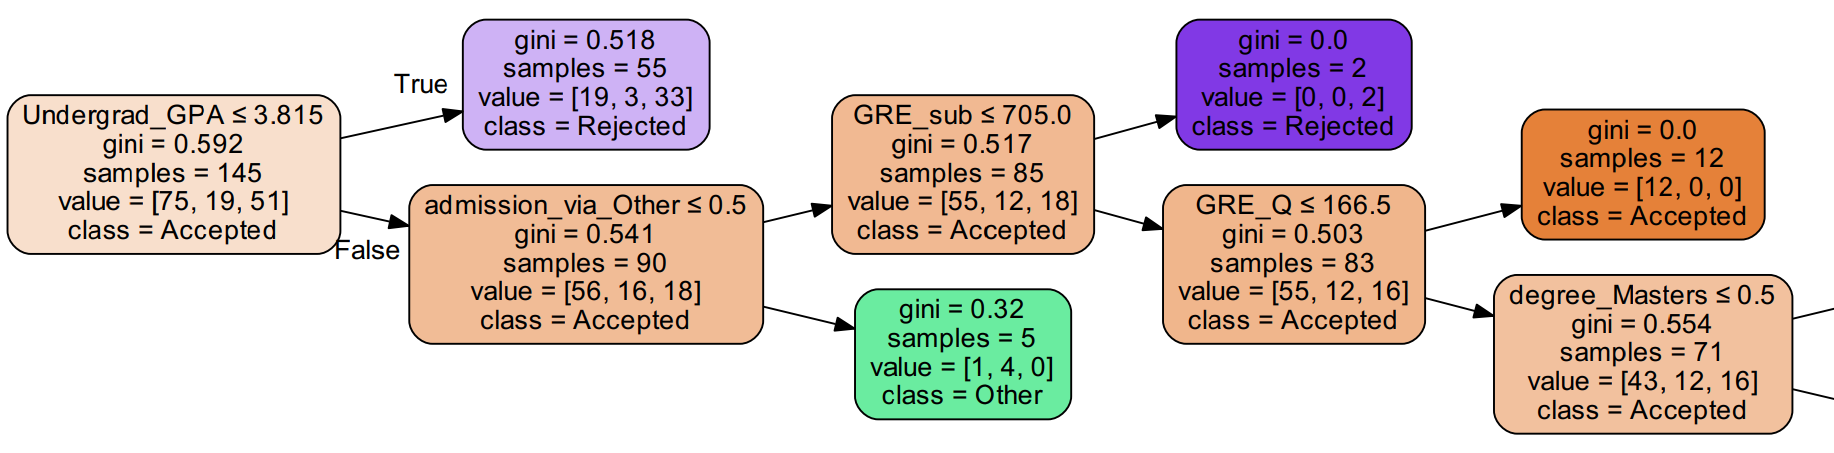
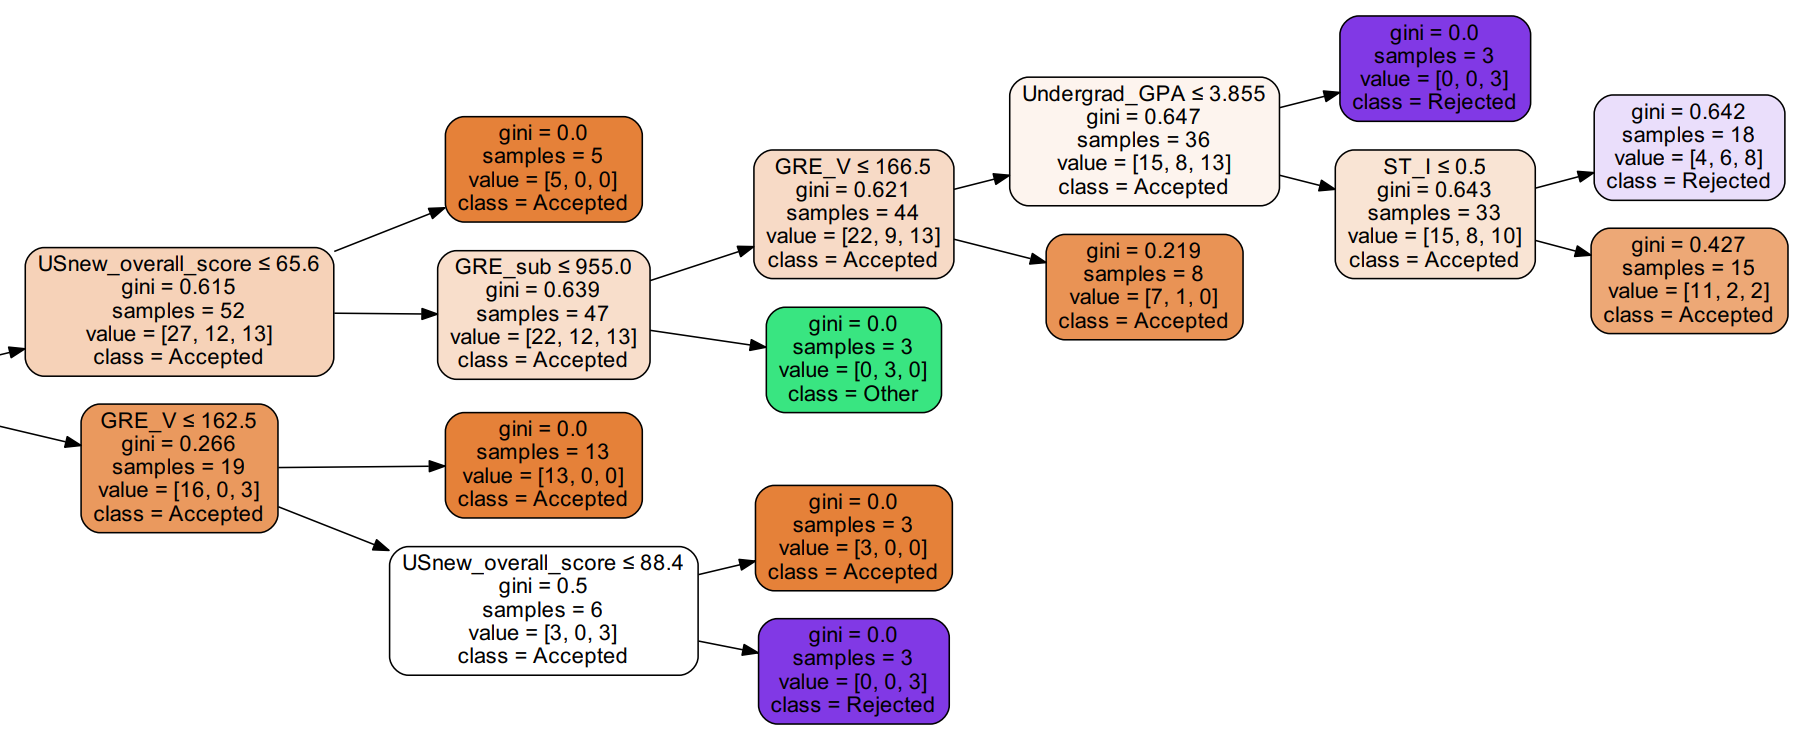
Because of the large amount of missing data, the decision tree classifier does not perform very well in terms of prediction accuracy (0.51). Data imputation does not make sense in this case since almost all missing data happens in numerical variables such as GPA and GRE and missing is not random. We can neither impute randomly nor with other variables.
However, the classifier does provide some important interpretations towards graduate application (statistics). First, undergraduate GPA plays an essential role in graduate application (statistics). One needs to focus on his/her courses during undergraduate if he/she wants to apply for a competetive statistics graduate program. Second, GRE sub is important if undergraduate GPA is not competetive. Meanwhile, due to data limitation, we can not include other important factors, such as recommendation and undergraduate school, into our classifier, which may affect the performance of it.
2. Where are we heading?
We show some interactive chropleth map, which is about the average admisson rate, average statistic score and numbers of applicants across the entire states. Admittedly, this is not the most useful way to look at gradcafe admission dataset, but still provides an interesting look at the relative numbers and admission conditions among different states.
2.1 Average statsitics score in each state
We show the average statistic score in each state. The average score is based on the score information from USnews statistics rank. From the interactive chropleth map, we mark top twelve states with the highest average statistics score.
We also summarise the top ten states with the highest statistics average score. Leading the list in washington state. This result is partially from our ranking data where there is only one university-- University of Washington, which has a first tier statistics program, in washington. In general, we can see some states in west coast, east coast and some where in the middle near the five lakes areas has the best statistics programs
2.2 States preference of applicants
According to the National Association for College Admission Counseling, in 1990, 9% of college freshmen applied to seven or more schools. By 2016, this percentage had increased to 35%. From the data we find that students still prefer to apply for some tier 1 statistics programs. Also, the preference varies a lot among the states.
Like the state itself, California's buffet of educational offerings is expansive, varied and colorful. As the most popular stats in the U.S. as well as the most economically fertile, California is home to a formidable population of college and university students. Another reason why California is popular is California's public higher education system, which has less tuition fees compared with private universities.
3. What do notes tell us?
There is usually lots of information given in the notes, sometimes even more relevant and informative than quantitative variables like GPA.
WordCloud: What do applicants talk about most? We generate and compare the WordClouds generated by the notes of PhD and Master applicants, respectively.
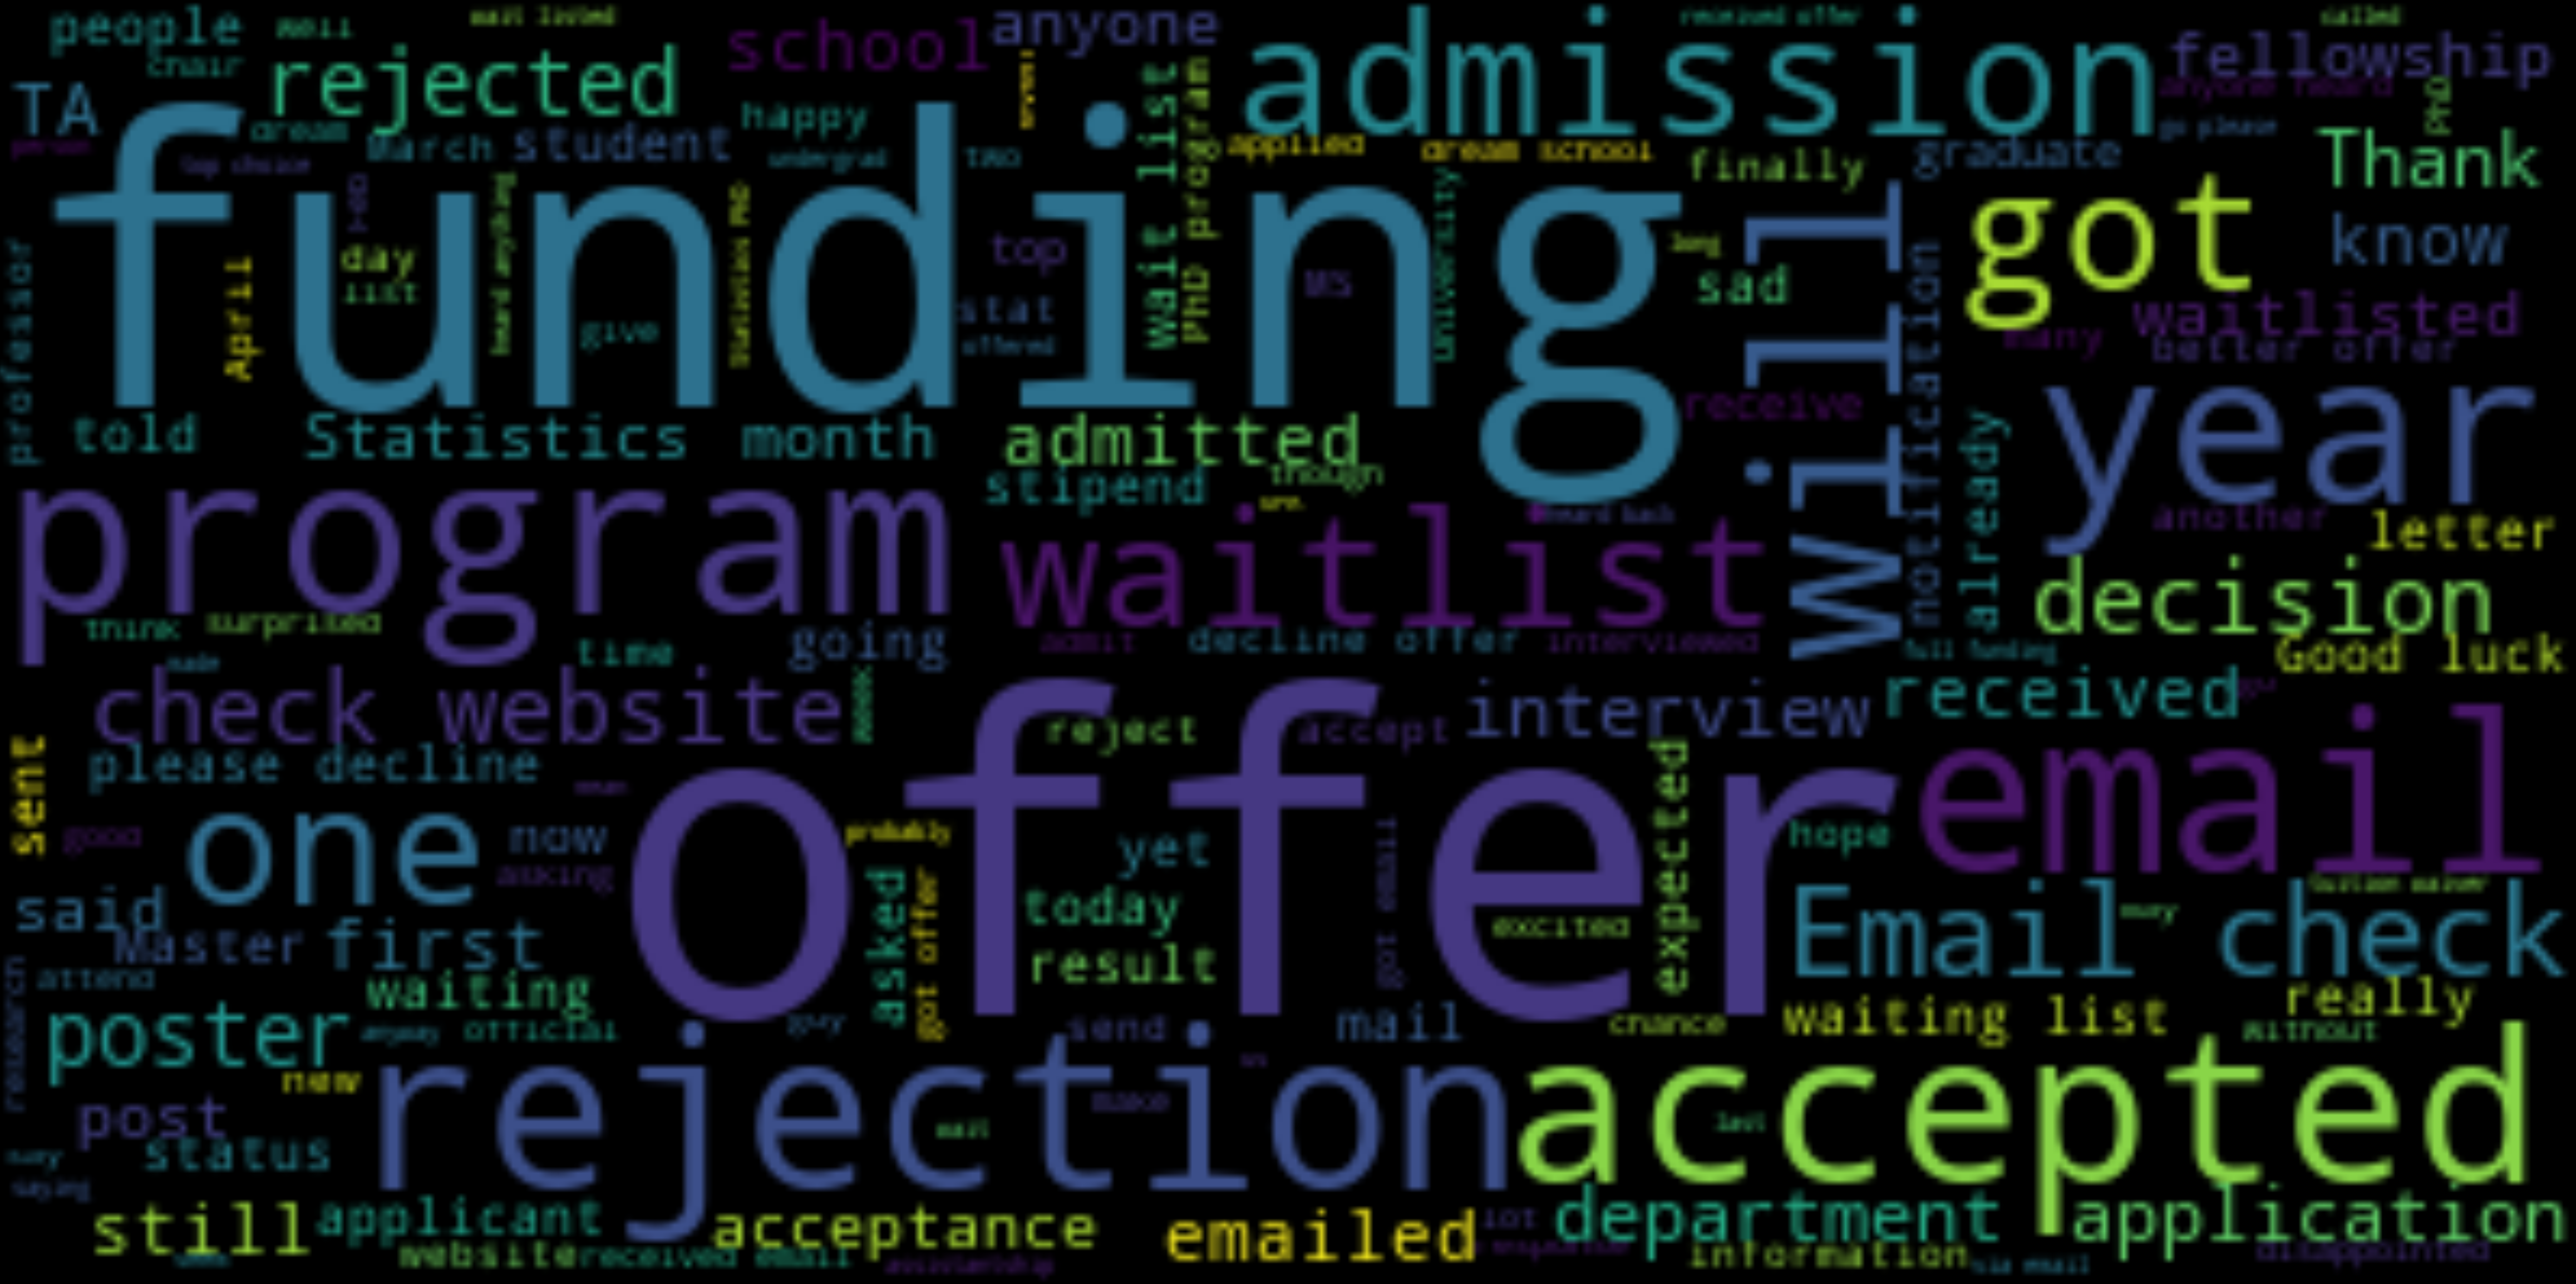
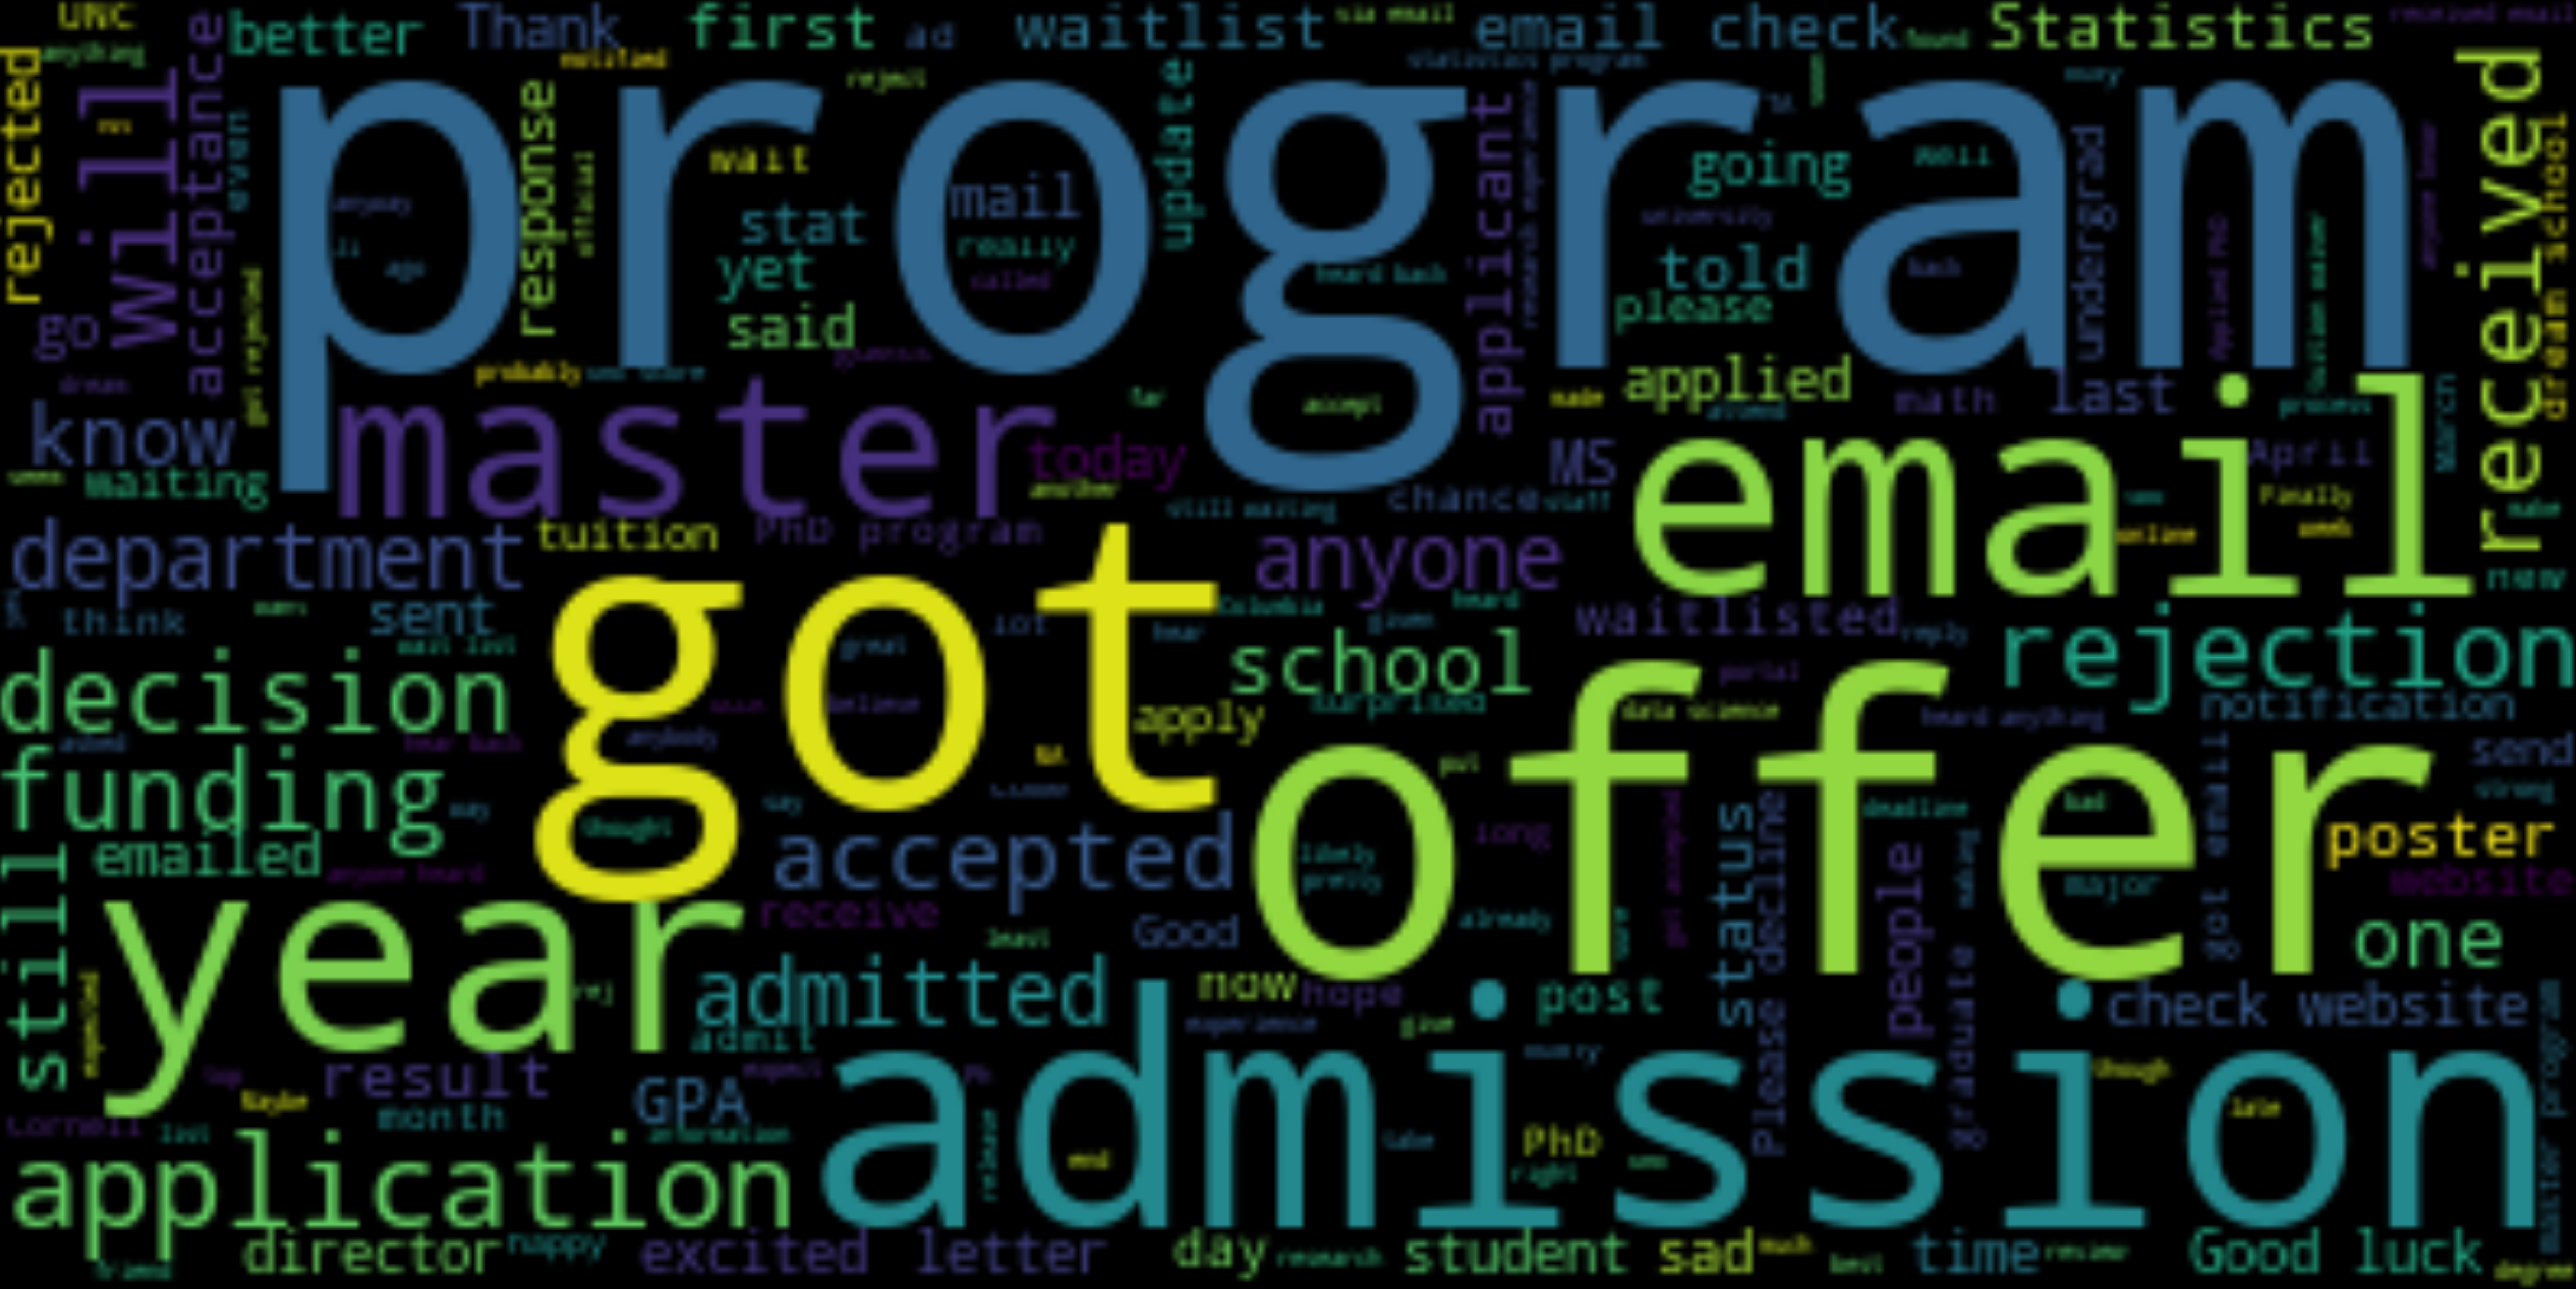
The topics appearing in PhD and master applicants are very much alike. Interestingly, PhD applicants seems to care more about funding. This makes sense as most doctoral programs are funded, which is not the case for Stats master's program.
We raise an interesting question here: can we use notes only to predict one's admission status? This should make sense--sometimes we can tell one's result by simply looking at the notes he left. We constructed a decision tree based on the tfidf-vectorized notes.
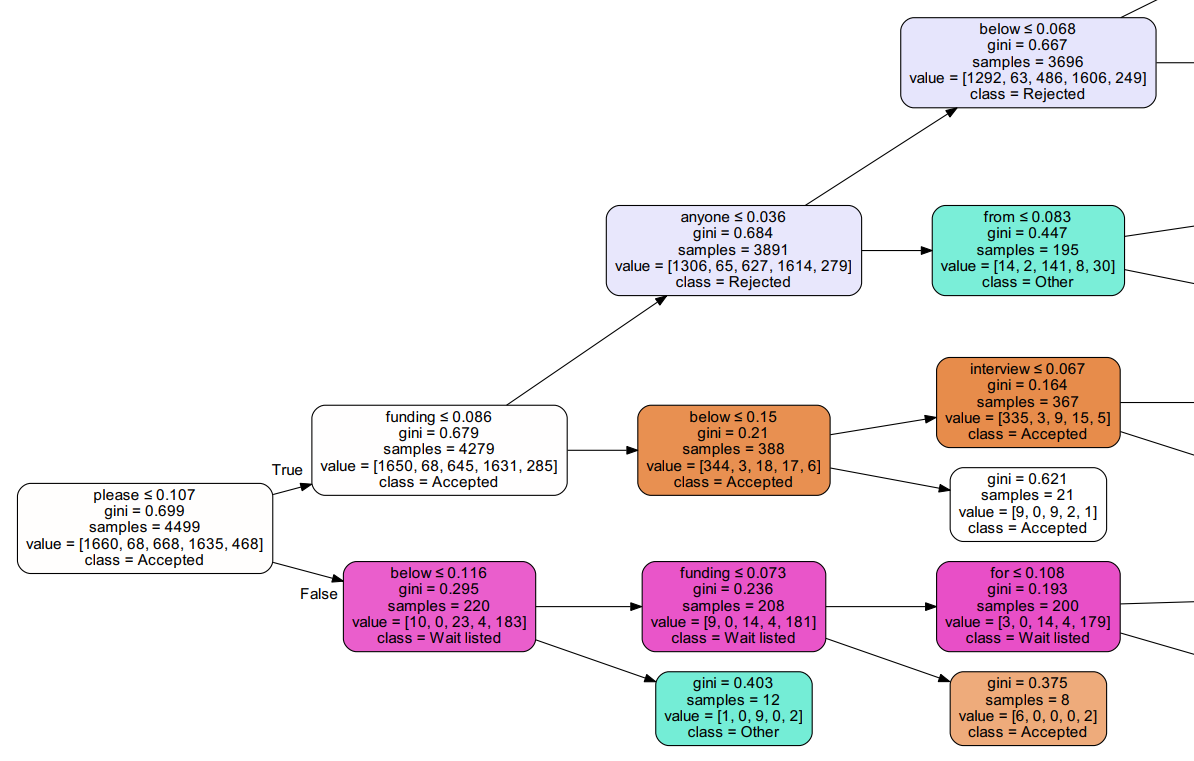
20 Most Important Words: ['please' 'funding' 'below' 'anyone' 'rejection' 'ta' 'sad' 'offer' 'tuition' 'the' 'interview' 'to' 'excited' 'fellowship' 'from' 'rejected' 'expected' 'check' 'wait' 'any']
10-fold Cross Validation Accuracy: 0.6663617916357338
Although, as expected, the notes itself does not have much predicting power (CV accuracy: 0.66), the nodes on top of the tree are rather interesting. To our surprise, the most important nodes is "please". This actually makes sense. When someone says "please", he/she is very likely to be "Waitlisted"--he/she is urging those who are holding offers but not going to decline as soon as possible. Here are some of the notes that contain "please":
I really want this offer for some reasons.
Hmm it is already April. Could you please turn down your offer if you have better choice. Thank you very much
I am still on waiting list for financial assistance. If you decided not to go JHU, please let them know as soon as possible.
If you decide not to go, please let the school know. Thank you!!!!!
Please withdraw if you got a better offer! This is my last chance :(
For the students who have already received the PhD offer, if you are not going to accept it, please please please decline it ASAP. I appreciate it.
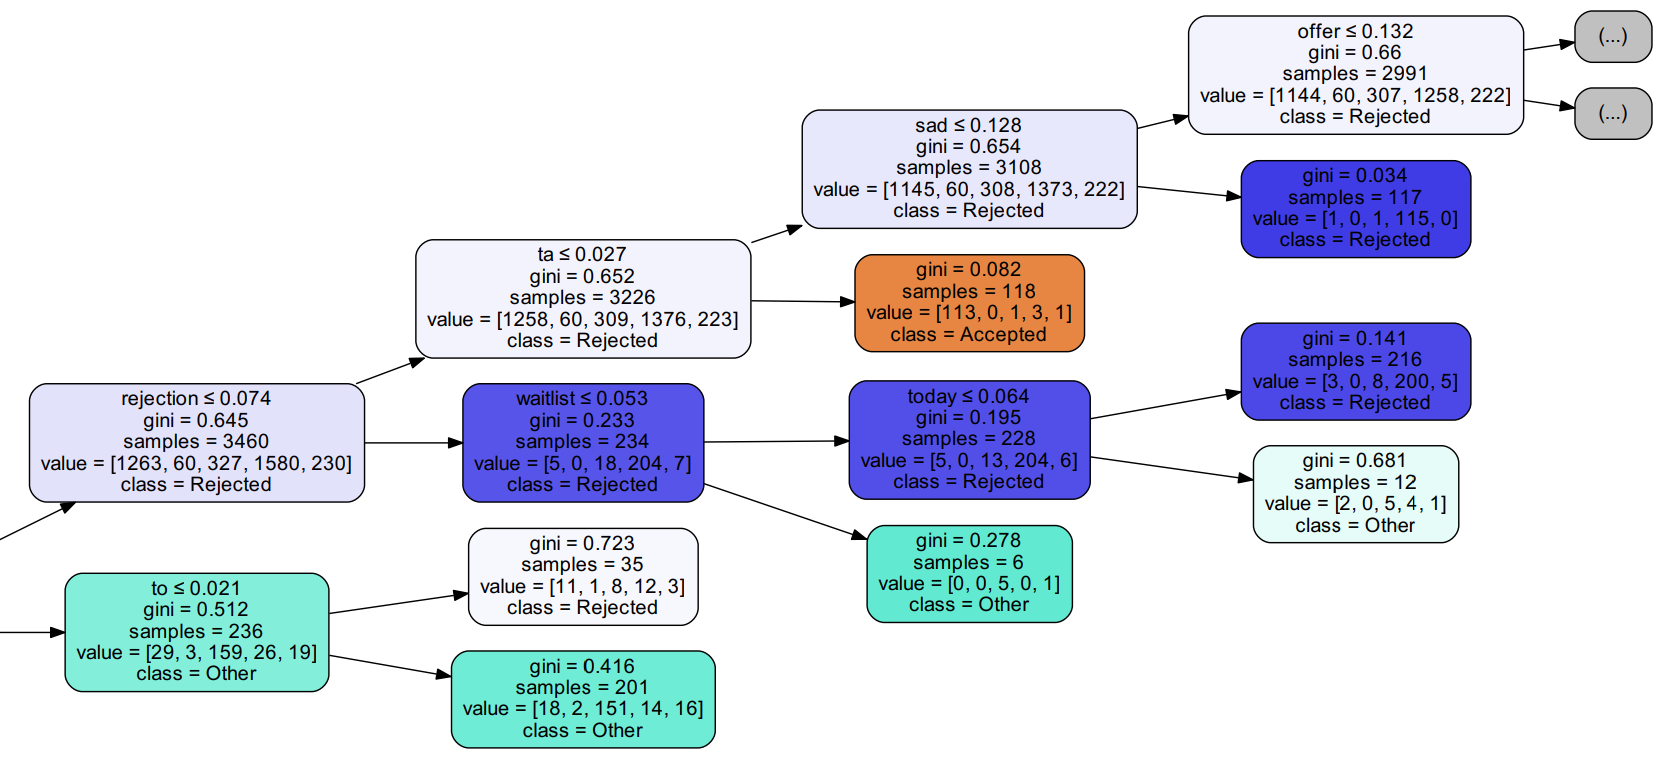
The appearance of some other words on the tree also makes sense. For example, if one mentions "funding" or "TA" he is likely to be accepted, while the word "sad" always means one has been rejected.